


The National Institute of Justice works closely with the Office of Juvenile Justice and Delinquency Prevention (OJJDP) to support a wide range of national data collection, analysis, and dissemination programs that inform the nation’s understanding of juvenile crime, victimization, and the juvenile justice system. These efforts serve as an invaluable resource for policymakers and juvenile justice professionals who work tirelessly to prevent juvenile delinquency, protect children, and improve the juvenile justice system.
In particular, the Juvenile Justice and Delinquency Prevention Act of 1974, as amended, requires OJJDP to submit to Congress and the president an annual report on juveniles in custody.[1] In response, OJJDP has sponsored statistical collections — now managed by NIJ — to gather information from residential placement facilities that hold juveniles who are charged with, or adjudicated for, law violations. Two of these collections — the Census of Juveniles in Residential Placement (CJRP) and the Juvenile Residential Facility Census (JRFC) — provide the most comprehensive information available on national- and state-level trends and characteristics of juveniles in residential placement.
The data from these collections have served the juvenile justice field well over the years and have led to important insights regarding the nature of and changes in facility populations, environments, and practices. However, challenges remain in maintaining and improving the quality, completeness, and utility of these data. To help advance data collection in the field, NIJ is currently working with OJJDP and other partners to review and redesign the CJRP and JRFC. This effort will help to generate the most useful, timely, and reliable statistics available to describe juveniles in residential placement and the conditions in, operations of, and services provided by the facilities in which they are held.
Children in Custody Census
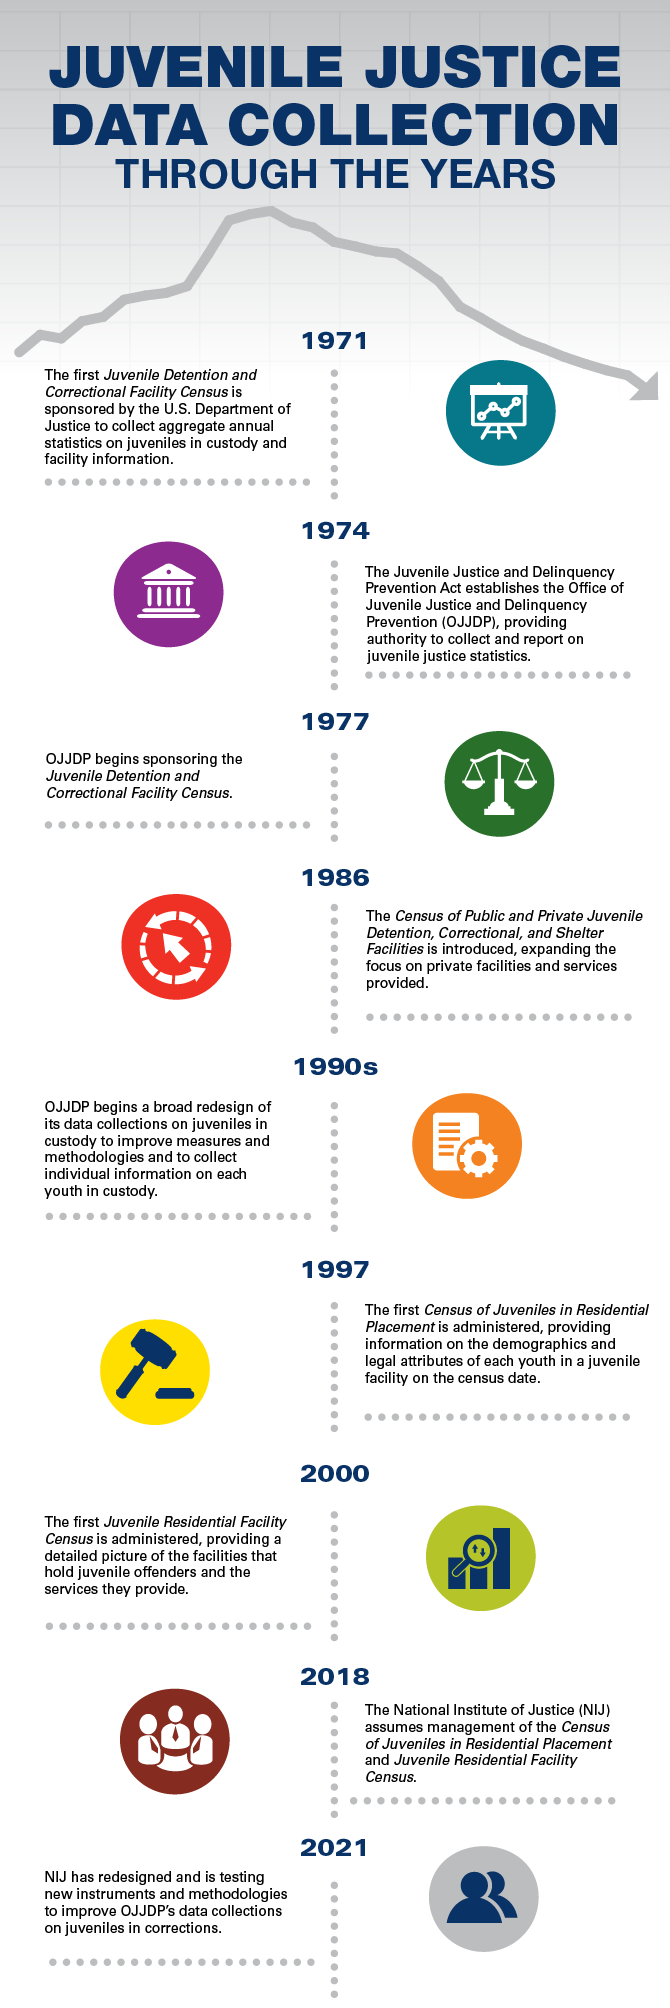
In 1971, the U.S. Department of Justice’s Law Enforcement Assistance Administration sponsored the first Juvenile Detention and Correctional Facility Census. The census replaced an annual survey on youth adjudicated delinquent that was conducted by the Department of Health, Education, and Welfare and published in a report series titled Statistics on Public Institutions for Delinquent Children. OJJDP took over sponsorship of the census in 1977, after the office was established under the Juvenile Justice and Delinquency Prevention Act of 1974.
Over time, the scope of the census expanded. In 1986, it became known as the Census of Public and Private Juvenile Detention, Correctional, and Shelter Facilities. Through 1995, it was typically conducted biennially, and findings were published in a report series titled Children in Custody. The reports provided information about the public and private facilities that held juveniles in custody and about the number and characteristics of the juveniles they held. The census included both one-day count items on the resident populations and annual items on admissions, discharges, and average length of stay.
The primary weakness of the census was that it collected only aggregate-level population data. This limited its utility for examining the intersection of juveniles’ demographic characteristics and legal attributes.
Early Data Improvements
In the early 1990s, OJJDP began a broad, long-term examination and redesign of its data collections on juveniles in custody. The office consulted extensively with content and methods experts, held discussions with respondents, and tested questions and methodologies. The result was the development of two new data collection programs — the CJRP and JRFC — to gather comprehensive and detailed information about juveniles in residential placement and the facilities that hold them.
The CJRP and JRFC are administered in alternating years and collect information from all residential placement facilities that house juveniles, defined as people younger than age 21 who are held in a residential setting for a delinquency or status offense.[2] This includes juveniles who are temporarily detained by the court and those who are committed after adjudication as part of a court-ordered disposition. The collections do not gather information on youth in federal facilities, adult prisons or jails, facilities used exclusively for mental health or substance abuse treatment, or facilities for abused or neglected children. The collections are currently managed by NIJ, in close collaboration with OJJDP and its data collection agent, the U.S. Census Bureau.
The CJRP provides a detailed picture of juveniles in residential placement, including the demographics and legal attributes of each youth in a juvenile facility on the census date. First administered in 1997, the CJRP typically takes place on the fourth Wednesday in October in odd-numbered years. It asks all juvenile residential facilities in the United States to describe each person younger than age 21 assigned a bed in the facility on the census date as a result of a delinquency or status offense. Facilities report individual-level information on each juvenile’s date of birth, gender, race, placement authority, most serious offense charged, court adjudication status, and admission date, as well as some information on facility-level characteristics.
The JRFC provides a detailed picture of the facilities that hold juveniles and the services these facilities provide. First administered in 2000, the JRFC is conducted on the fourth Wednesday in October in even-numbered years. The JRFC includes questions on facility ownership and operation, facility type, security, capacity and crowding, unauthorized departures, injuries, and deaths in custody. The JRFC also collects supplementary information each survey year on juvenile facility practices around identifying youth’s needs and the specific services that facilities provide, such as those related to mental health, physical health, substance use, and education needs.
Infographic - Juvenile Justice Data Collection Through the Years
Download a printable version of the infographic.
Current Trends and Characteristics
To understand current characteristics of juveniles in residential placement and juvenile facilities, researchers supported through the NIJ-managed National Juvenile Justice Data Analysis Program analyzed data from the most recent CJRP and JRFC.[3]
See “Juvenile Court Statistics”
Juveniles in Residential Placement, 2019
On October 23, 2019, residential placement facilities held 36,479 juveniles, which was 65% below the 1997 level when 105,055 youth were held in placement.[4] In fact, by 2019 the total number of juveniles in placement reached its lowest level since at least 1975.[5] Between 1997 and 2019, declines were greater for committed youth (down 72%) than for detained youth (down 49%). In 2019, there were 114 juveniles in placement for every 100,000 juveniles in the U.S. population.[6] There was substantial variation in juvenile residential placement rates by state; however, rates declined in every state from 2007 to 2019, and many states cut their rates by half ( see exhibit 1).

Note: Relative declines from 1997 to 2019 were greater for committed youth (72%) than for detained youth (49%). Total includes detained youth, committed youth, and a small number of youth in placement as part of a diversion agreement. The Census was conducted on the following dates (month/year): 10/1997, 10/1999, 10/2001, 10/2003, 02/2006, 10/2007, 02/2010, 10/2011,10/2013, 10/2015, 10/2017, and 10/2019.
Source: Sarah Hockenberry, Juveniles in Residential Placement, 2019, Washington, DC: U.S. Department of Justice, Office of Juvenile Justice and Delinquency Prevention, In press. (View larger image.)
Nationally, 43% of juvenile held were held for person offenses, followed by property offenses (22%), technical violations and public order offenses (14% each), and drug offenses (4%). Youth held for status offenses made up 4% of the placement population.
More than half (52%) of juveniles in residential placement were age 16 or 17. Youth ages 13 through 15 made up 32% of those in placement. Females accounted for 15% and males 85% of juveniles in residential placement. Forty-seven percent of the U.S. juvenile population were minorities, but minority youth accounted for 67% of juveniles in residential placement. Non-Hispanic Black youth made up the largest proportion (41%), followed by non-Hispanic white (33%) and Hispanic (21%) youth. Non-Hispanic youth of other races, including those of two or more races, accounted for 6% of youth in residential placement.
The median days in placement since admission was 113 days for committed juveniles and 26 days for detained juveniles.[7] Thirty-three percent of committed juveniles and about 8% of detained juveniles remained in placement six months after admission.
Juvenile Residential Facilities, 2018
In 2018, 40% of all facilities were private, but they held only 27% of juveniles in placement (see exhibit 2).[8] Sixty percent were public facilities and held the majority of juveniles, with local facilities (38%) holding more youth than state facilities (35%). Facilities most commonly identified themselves as detention centers (41%), residential treatment centers (37%), or group homes (16%).[9] Other reported facility types included long-term secure facilities, shelters, reception/diagnostic centers, and ranch/wilderness camps.

Source: Sarah Hockenberry and Anthony Sladky, Juvenile Residential Facility Census 2018: Selected Findings, Washington, DC: U.S. Department of Justice, Office of Juvenile Justice and Delinquency Prevention, 2020. (View larger image.)
Security features and practices varied across types of facilities. For example, 49% of facilities reported that they locked youth in their sleeping rooms; however, the percentage was much higher for local (81%) and state (69%) facilities than for private facilities (8%). Similarly, 29% of facilities reported using external fences or walls with razor wire, but this was most common among facilities that identified as reception/diagnostic centers (60%), training schools (55%), and detention centers (50%). About one-quarter of facilities (27%) reported using mechanical restraints in the previous month, and 22% reported locking youth alone in some type of seclusion for four or more hours to regain control of their unruly behavior.
Facility crowding affected a relatively small proportion of youth in custody. Eighteen percent of facilities reported that the number of residents they held on the 2018 census date put them at or over the capacity of their standard beds or that they relied on some makeshift beds. In 2018, 1% of facilities reported being over capacity, down from 8% of facilities in 2000.
Most facilities reported screening youth for suicide risk and treatment needs. All youth were evaluated for suicide risk in 95% of facilities, for education needs in 88% of facilities, for substance abuse problems in 75% of facilities, and for mental health needs in 63% of facilities. The majority of facilities reported screening all or some youth for service needs within one week of admission. More than half of facilities (62%) reported providing onsite treatment services. Of facilities providing treatment, the largest proportion provided mental health services (86%), followed by substance abuse services (70%), services for those having committed sex offenses services (36%), service for those committing violent offenses (21%), and services for those committing arson (10%).
Juvenile facilities reported only eight deaths of youth younger than age 21 in residential placement for the 12 months prior to the 2018 census. Suicide was the most commonly reported cause of death (six deaths). The death rate was 2.1 per 10,000 youth in placement. Deaths of juveniles in residential placement remained relatively rare and well below the levels recorded in prior decades.
Ongoing Data Collection Challenges
There is an ongoing struggle across establishment censuses to ensure data quality while maintaining high response rates and reducing respondent burden. The CJRP and JRFC, which routinely achieve response rates near 90%,[10] are no exception. One way to meet these challenges is to clearly demonstrate the practical utility and unique contribution of the data to respondents, as well as more broadly to inform policy, practice, and the general public.
Notably, the items included in the CJRP and JRFC survey instruments have largely remained the same since their original design more than 20 years ago. Although this continuity is important to support trends for core estimates, the data show that there have been dramatic changes in juvenile corrections during this period. The juvenile residential placement population has been reduced by more than half. Security and safety in facilities remain paramount, but juvenile corrections practice is increasingly focused on appropriately screening youth and delivering rehabilitative services that are shown by research to reduce reoffending and promote prosocial youth outcomes. Youth are now more commonly held in facilities that are smaller, less crowded, and run by county or municipal governments. In addition, there is greater automation of data, and many facilities have improved their infrastructure for tracking and reporting youth and facility-level information.
Strategy for Future Data Improvements
NIJ and OJJDP have worked closely with the U.S. Census Bureau over the past few years to assess the performance of the data collections and identify potential opportunities for improvement. The assessment process included conducting respondent debriefings following data collection cycles, analyzing methods of response and other respondent behavior, and examining nonresponse patterns. This work provided an initial foundation for understanding respondent preferences and priorities for key data items, how respondents interacted with the web survey instruments, how nonresponse varied by key facility attributes such as location and size, and the potential for nonresponse bias in the population estimates produced from the collections.
To advance these efforts, NIJ is managing a study of how to redesign OJJDP’s data collections on juveniles in corrections.[11] The study, led by RTI International, will result in improved data collection instruments and methodologies for generating statistics on the number and characteristics of juveniles in residential placement and information about the facilities in which they are held. In collaboration with NIJ, OJJDP, and other federal partners, the project team is conducting a comprehensive assessment of the current data collections and will develop and pilot test the redesigned CJRP and JRFC instruments and data collection methodologies. The project team has also engaged an expert panel of juvenile corrections leaders, researchers, and other juvenile justice practitioners to ensure that the project recommendations fully address information gaps and needs in the field.
This project will help improve the nation’s primary effort to gather statistical data on juveniles in residential placement and make that information accessible to researchers, practitioners on the front lines, and policymakers at the federal, state, and local levels. NIJ remains committed to ensuring the dissemination of and access to clear, comprehensive, and reliable data to meet the pressing needs of the juvenile justice field.
For More Information
- To learn more about juvenile crime, victimization, and youth involved in the juvenile justice system, visit OJJDP’s online Statistical Briefing Book.
- Access national and state data from the Juvenile Residential Facility Census.
- Original data from the two collections are archived at the National Archive of Criminal Justice Data.
About This Article
This article was published as part of NIJ Journal issue number 283.
This article discusses the following awards:
- “National Juvenile Justice Data Analysis Program,” award number 2019-JX-FX-K001
- “FY 18 Redesign Study of OJJDP’s Juveniles in Corrections Data Collections,” award number 2018-JX-FX-K001
- “National Juvenile Court Data Archive,” award number 2018-JX-FX-0002
Sidebar: Juvenile Court Statistics
National statistics on how cases referred to juvenile court are processed, including detention and disposition decisions, are also available. In 1929, the Children’s Bureau within the U.S. Department of Labor first published the Juvenile Court Statistics report. The report presented delinquency and dependency case information for calendar year 1927 based on data reported by 42 courts in 15 states.[12] In the 1950s, the Children’s Bureau and its work were transferred to the U.S. Department of Health, Education, and Welfare. In 1974, the Juvenile Justice and Delinquency Prevention Act established the Office of Juvenile Justice and Delinquency Prevention (OJJDP), which then assumed responsibility for the collection and reporting of juvenile court statistics.
Today, the National Juvenile Court Data Archive,[13] sponsored by OJJDP and managed by the National Institute of Justice, collects detailed, case-level data and court-level aggregate statistics to generate national estimates of delinquency and petitioned status offense caseloads. The archive is supported through a grant to the National Center for Juvenile Justice, the research division of the National Council of Juvenile and Family Court Judges. The most recent report includes data from more than 2,500 courts with jurisdiction over 87% of the juvenile population in 2018.[14]
The Juvenile Court Statistics report provides information on the use of detention between court referral and case disposition and on the most severe initial disposition in each case, which includes commitment to a residential facility.[15] The number of delinquency cases involving detention decreased 52% between 2005 and 2018. However, the proportion of cases detained was slightly larger in 2018 (26%) than in 2005 (25%). Similarly, the number of cases adjudicated delinquent that resulted in out-of-home placement decreased 59% from 2005 to its lowest level in 2018. Courts ordered out-of-home placement in 28% of all cases adjudicated delinquent in 2018, a proportion that was relatively stable between 2005 and 2018.