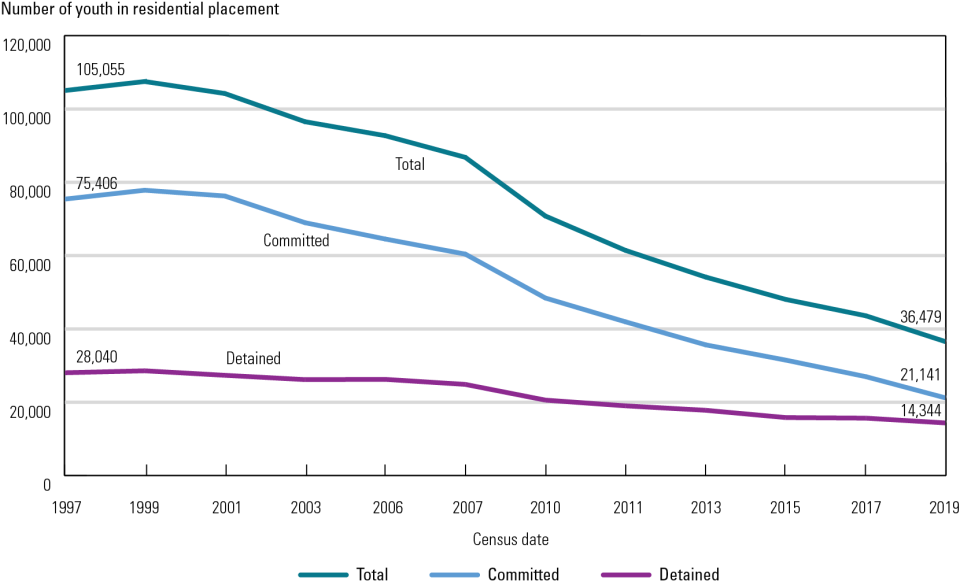
Exhibit 1, "Decline in Youth in Residential Placement," from the article "Advancing the Collection of Juvenile Justice Data"
From the article "Advancing the Collection of Juvenile Justice Data," February 22, 2021.
Note: Relative declines from 1997 to 2019 were greater for committed youth (72%) than for detained youth (49%). Total includes detained youth, committed youth, and a small number of youth in placement as part of a diversion agreement. The Census was conducted on the following dates (month/year): 10/1997, 10/1999, 10/2001, 10/2003, 02/2006, 10/2007, 02/2010, 10/2011, 10/2013, 10/2015, 10/2017, and 10/2019.
| Count | Detained | Committed | Diversion | Other/unknown | Total |
|---|---|---|---|---|---|
| 1997 | 28,040 | 75,406 | 1,248 | 361 | 105,055 |
| 1999 | 28,576 | 77,835 | 611 | 471 | 107,493 |
| 2001 | 27,346 | 76,262 | 569 | 42 | 104,219 |
| 2003 | 26,170 | 68,982 | 1,318 | 61 | 96,531 |
| 2006 | 26,238 | 64,532 | 1,864 | 87 | 92,721 |
| 2007 | 24,868 | 60,412 | 1,492 | 42 | 86,814 |
| 2010 | 20,579 | 48,428 | 1,735 | 51 | 70,793 |
| 2011 | 19,014 | 41,934 | 464 | 11 | 61,423 |
| 2013 | 17,803 | 35,659 | 644 | 42 | 54,148 |
| 2015 | 15,816 | 31,487 | 564 | 176 | 48,043 |
| 2017 | 15,660 | 26,972 | 455 | 493 | 43,580 |
| 2019 | 14,344 | 21,141 | 500 | 494 | 36,479 |
Source: Sarah Hockenberry, Juveniles in Residential Placement, 2019, Washington, DC: U.S. Department of Justice, Office of Juvenile Justice and Delinquency Prevention, In press.


