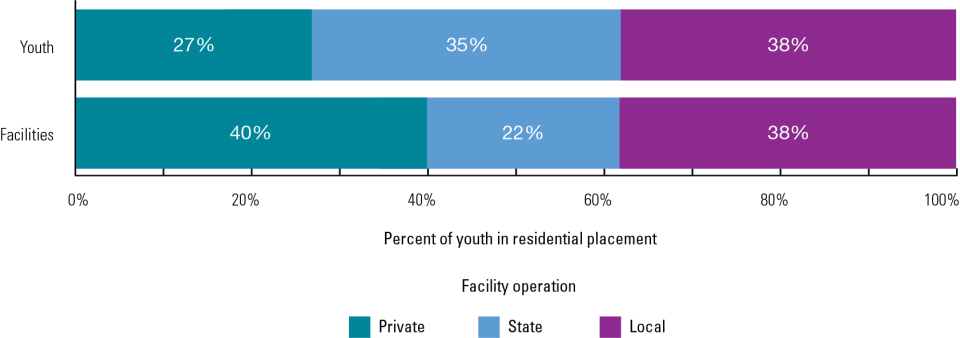
Exhibit 2, "Characteristics of Juvenile Residential Facilities in 2018" from the article "Advancing the Collection of Juvenile Justice Data"
From the article "Advancing the Collection of Juvenile Justice Data," February 22, 2021.
Note: In 2018, 40% of all facilities were private, but they held only 27% of juvenile offenders in placement. Sixty percent were public facilities and held the majority of juvenile offenders, with local facilities (38%) holding more youth than state facilities (35%).
| Facility operation | Number of facilities | Percent of facilities | Number of juvenile offenders | Percent of juvenile offenders |
|---|---|---|---|---|
| Total | 1510 | 100% | 37529 | 100% |
| Public | 903 | 60% | 27469 | 73% |
| State | 331 | 22% | 13221 | 35% |
| Local | 572 | 38% | 14248 | 38% |
| Private | 607 | 40% | 10060 | 27% |
Source: Sarah Hockenberry and Anthony Sladky, Juvenile Residential Facility Census 2018: Selected Findings, Washington, DC: U.S. Department of Justice, Office of Juvenile Justice and Delinquency Prevention, 2020.


