In early 2017, the South Precinct of the Metro Nashville Police Department was struggling with high numbers of motor vehicle crashes that were straining limited resources. This scenario is not limited to Nashville. During 2017, according to the National Highway Traffic Safety Administration, 6.4 million motor vehicle traffic crashes were reported by police throughout the United States.[1] Compared to other areas of policing, research on traffic enforcement and the role of police in reducing crashes is relatively limited.[2] However, the research available does suggest that sustained enforcement actions discouraging the driving behaviors that lead to crashes can have a positive impact on reducing them.[3] In Nashville, a concerted effort was made to delve into the traffic crash data and use that data to develop a strategy to reduce crashes in the target areas. By using the data collected from various sources, a clearer picture of the crash problem emerged. This data analysis led to two high-visibility enforcement (HVE) plans that aimed to reduce the harms associated with crashes and improve policing outcomes. The HVE plans were focused solely on traffic crash data and were in no way associated with crime statistics or a crime prevention strategy.
The first HVE plan was developed in the South Precinct of the Metro Nashville Police Department. Crashes were causing a significant strain on resources there. Between 2016 and 2018, the Metro Nashville Police Department reported over 33,000 crashes per year.[4] Patrol officers spent an average of 100 minutes on each crash they responded to.
The first step in developing the plan was to identify the location where the enforcement was to take place. One particular roadway had seen a recent fatal crash. Using the department’s Compstat report and records management system, two segments along the same roadway were found to have 14 crashes per week compared to a similar roadway segment that experienced six crashes per week. Temporal analysis showed that crashes were more likely in the hours leading up to the evening rush hour. Finally, with the help of the Tennessee Department of Safety’s Tennessee Integrated Traffic Analysis Network, the leading contributing factors to crashes in the target location were identified. These contributing factors included drivers following improperly and failing to maintain their lane. It is believed that driver distraction could be an underlying factor when drivers strike the vehicle in front of them (attributed to following improperly) or fail to maintain their lane. The various types of distractions — cellphones, radios, eating, navigation systems — take attention away from safe driving behavior.
HVE is a proven countermeasure and universal traffic-safety approach designed to create deterrence and change unlawful and risky driving behaviors. HVE combines highly visible and proactive law enforcement strategies to target specific violations. The ultimate goal of HVE is to deter risky driving behaviors and subsequently reduce crashes in the targeted area.[5] The HVE model was paired with a hypothesis based on the Koper Curve. The study that resulted in the Koper Curve found that “Police can maximize crime and disorder reduction at hot spots by making proactive, 10-15 minute stops at these locations on a random, intermittent basis, thus maximizing deterrence and minimizing the amount of unnecessary time spent at hot spots.”[6] In the application of this particular HVE plan, it was hypothesized that the enforcement “waves” could have an ideal dosage to reduce crashes. Based on the previous identification of corridors with high numbers of crashes and the associated temporal analysis, the Koper method was applied to target the driving behaviors associated with traffic crashes. We hypothesized that implementing HVE plans along the roadway segment hot spots would reduce the number of traffic crashes in an efficient manner. Two interventions were implemented to determine the effectiveness of our efforts to reduce crashes.
Experiment 1: Pilot Project Testing of HVE
The HVE plan focused a group of officers along the target areas for two hours leading up to the afternoon rush hour for two days a week, once a month — the initial dosage. Officers were given specific instructions to seek out and enforce only those violations that correlated to the contributing factors discovered in the data analysis. The emphasis was not on the number of traffic stops or tickets but rather on behaviors they observed that could lead to a crash, such as distracted driving, following too closely, and speeding. Distracted driving could include cellphone usage, eating and drinking, other passengers, and anything else that takes the driver’s attention away from safe driving actions.
The plan used on-duty officers from the patrol precinct and generally consisted of six to eight officers for each wave. The group consisted of officers who were on a proactive precinct “flex” team as well as precinct-level traffic officers. Those on the flex team were uniformed officers who generally did not answer calls for service but were deployed for proactive crime prevention activities. These officers were included in the planning phase as well as in briefings after each enforcement period, which created buy-in among the officers who participated.
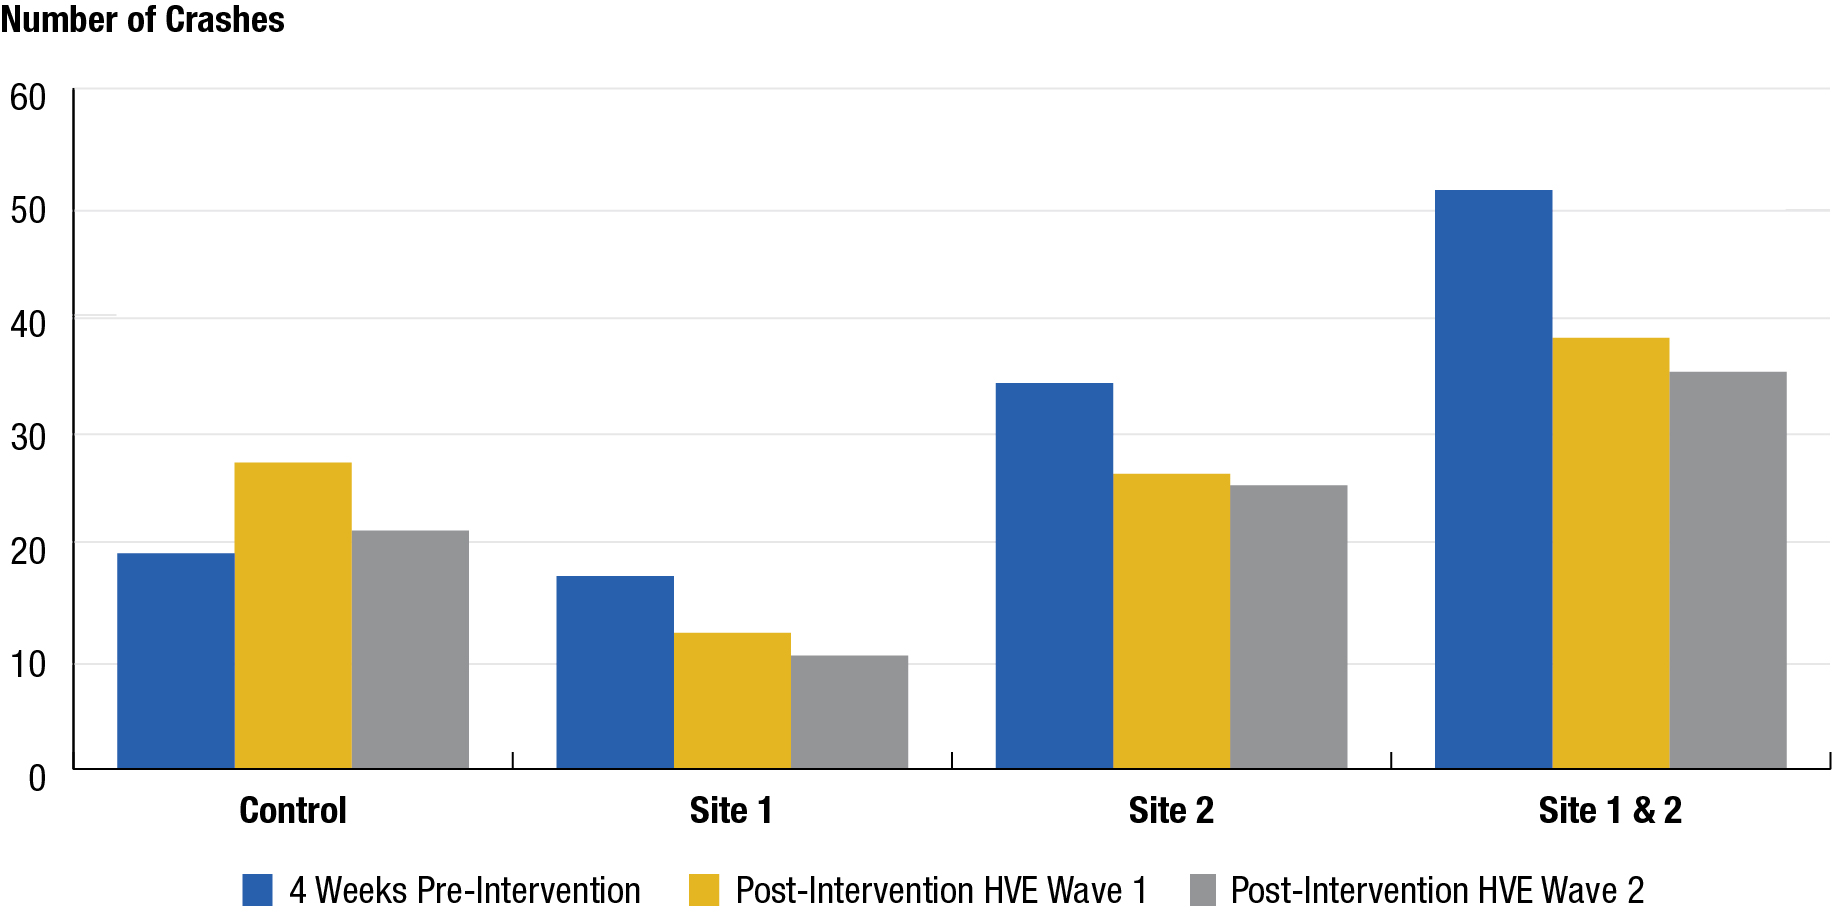
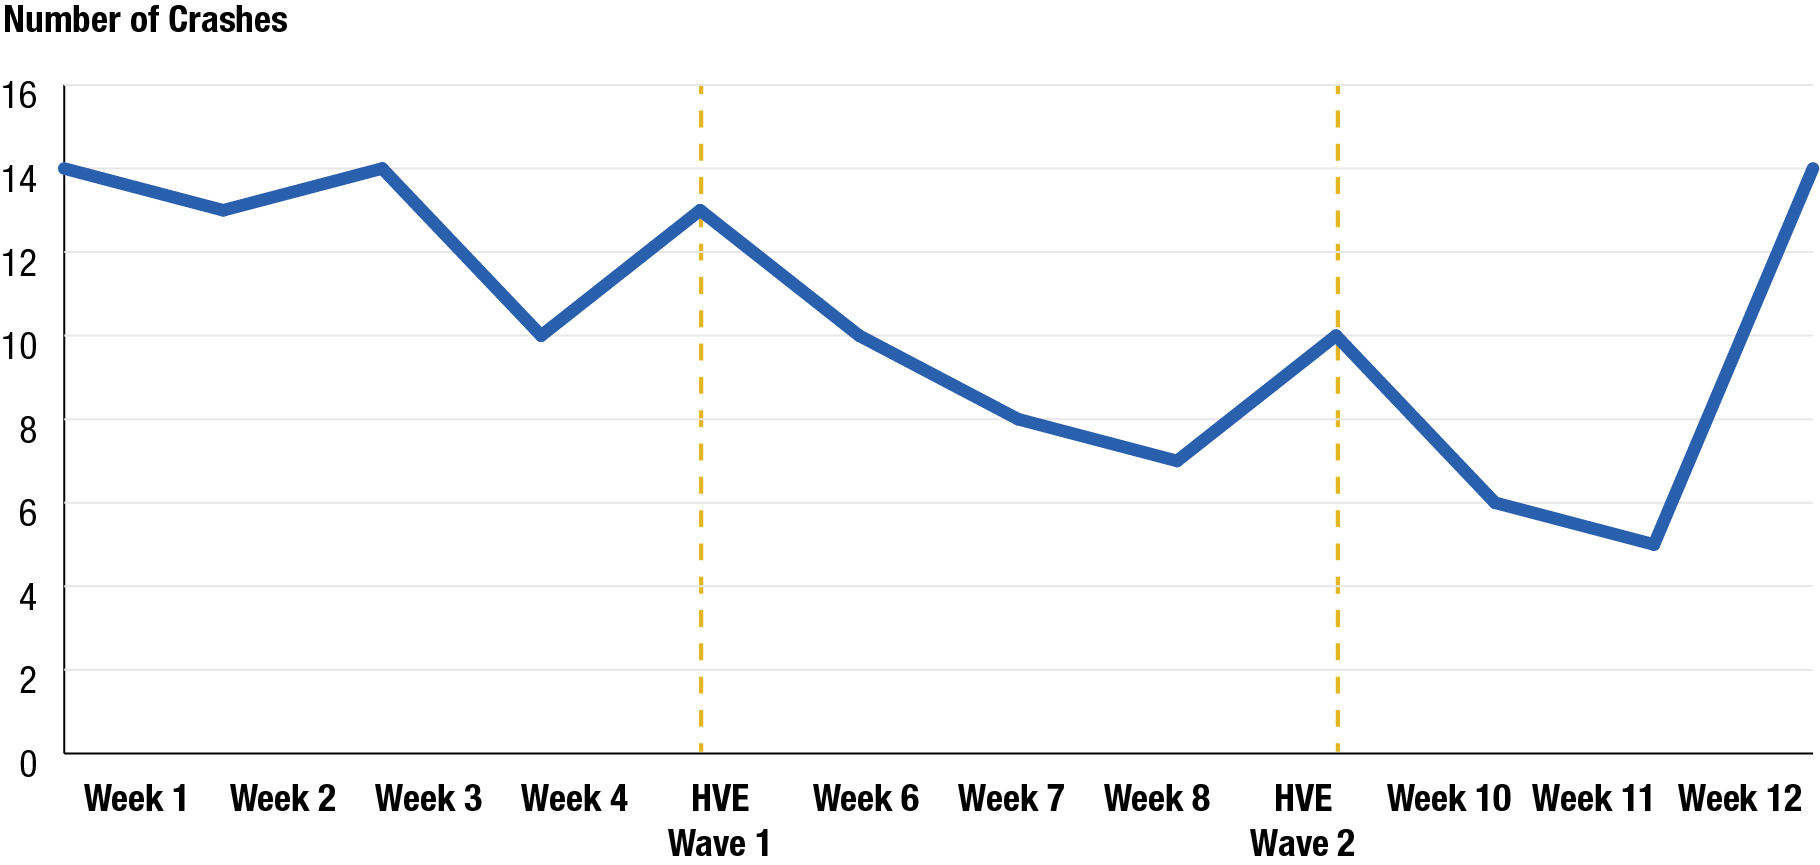
The results from this initial 2017 program demonstrated a reduction in crashes in the target area (see exhibit 1). At the beginning of the enforcement plan, the roadway segment that was chosen averaged 12 crashes per week (seven property damage crashes and five injury crashes). After using the HVE plan for three months, the target area averaged eight crashes per week (five property damage crashes and three injury crashes). During this period, there were no major events or major changes impacting traffic flow, such as construction. These numbers averaged out to a 33% reduction over a three-month intervention period. Data from the department had shown that, on average, an officer spent 100 minutes from the time dispatched to the completion of each crash investigation. Assuming that one officer responds to each crash, the reduction represented a decrease of more than 26 man-hours per month in time spent on crashes. During the same period, crashes throughout the city were trending upward. A comparison site’s crash counts were also tracked during the same period, and this site shared some of the same characteristics as the roadway segment where the enforcement was conducted — it had a similar number of lanes and vehicle travel, and no directed HVE was conducted. This site was characterized by a “business as usual” approach, in which officers conducted random independent enforcement if violations were observed. The crash counts at the comparison site showed a slight upward trend during the same period as the experiment.
An analysis of the plan’s results also uncovered an optimal dosage for the target area. While the plan called for the enforcement to occur once a month, the data indicated a shorter effective window. After an enforcement wave, crashes declined for three weeks. Typically, in the fourth week after the enforcement, the crash count would begin to increase. Optimal dosage in the target area was two days a week for two hours each day, every three weeks (see exhibit 2).
Experiment 2: Expanded Testing of HVE
In 2019, the police department’s Traffic Section identified a need to expand and experiment with the initial plan piloted in the South Precinct. There was an increased interest in implementing data-driven and evidence-based traffic enforcement programs throughout the county. There was also a need for a clear traffic crash reduction plan across all police precincts in Nashville. Again, an HVE strategy was deployed, which provided an opportunity to further test the strategy from the previous initiative at a larger scale and among a variety of locations. At the conclusion of this experiment, we also evaluated the results not only for effectiveness and efficiency but also to ensure that the plan did not unfairly target any one demographic in the community.
The citywide plan involved much of the same process as the 2017 South Precinct plan. Target areas were identified in seven police precincts and again focused on roadway segments. Armed with the knowledge developed in the South Precinct, the Traffic Section set out to create a dosage schedule covering a six-week period for all of the identified hot spots.
Data were used much more broadly in developing this plan. For example, the specific contributing factors for each hot spot were not examined. Instead of identifying which violations were contributing to crashes in individual hot spots and focusing on those violations, officers were asked to focus on the same violations across every hot spot. These violations were the same as those in Experiment 1 — the focus was on moving violations and the unsafe driving behaviors that lead to crashes. Some of these violations, such as speeding and drivers’ failure to maintain their lane, are the leading factors in the fatal crashes throughout the city. Since citywide data were used for all of the hot spots, it is possible that we did not have as great an impact on crashes as we could have if data specific to each hot spot were used.
The citywide plan implemented two-hour enforcement waves at each hot spot over two consecutive days. Unlike Experiment 1, in which enforcement occurred at times when violations were highest, the current plan implemented waves at different periods over the two days. This was done to account for a citywide temporal analysis that showed crash likelihood spanned several hours. Every two days the officers would go to a hot spot in a different precinct. This schedule created a prescribed dosage of every 2½ to three weeks for each hot spot. During the enforcement periods, officers would generally conduct roving patrol in the area and stop violators they observed while driving through the area. In locations that safely allowed it, officers might conduct stationary patrol, where they would position their vehicle on the shoulder or on the side of the roadway to conduct speed enforcement.
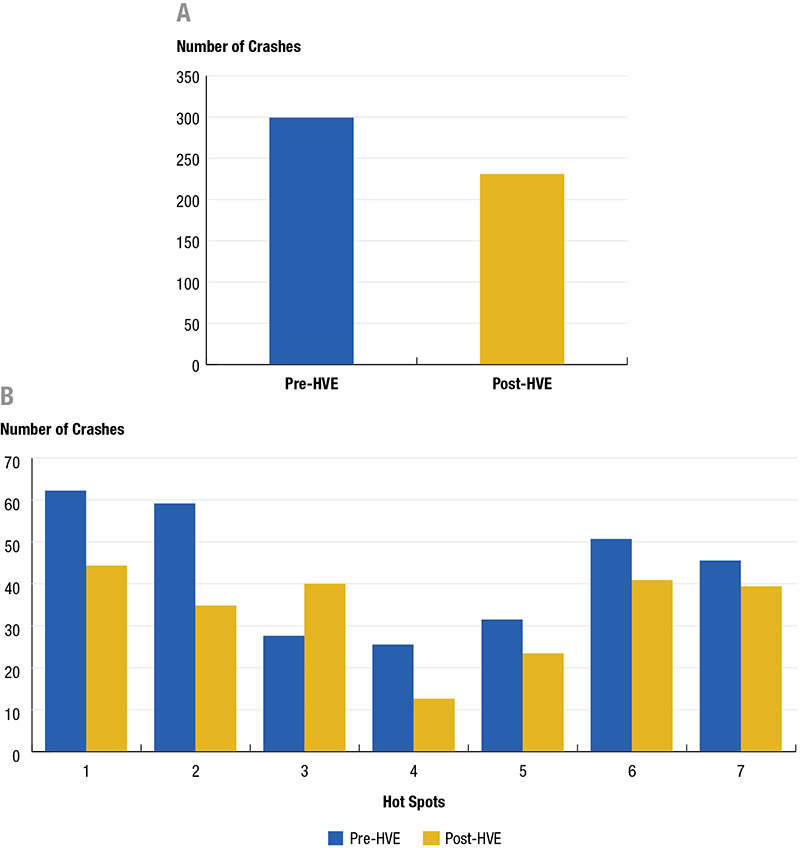
The enforcement trial conducted by the Traffic Section provided only four enforcement waves at each hot spot but did have some positive impacts on crashes. However, a reduction in crashes did not occur at all hot spots. Overall, in the six weeks prior to the enforcement, the seven hot spots accounted for 297 crashes. In the six weeks following the first enforcement wave at each hot spot, there were 230 crashes across the seven hot spots (see exhibit 3A), for an overall 22.56% reduction in crashes. During the enforcement periods, there were no major events or major changes impacting traffic flow, such as construction, at any of the selected hot spots. Six of the seven hot spots showed reductions in crashes. Some of the reductions were considerable, including a reduction of just over 50% at one hot spot, while others were between 10% and 20% (see exhibit 3B). In contrast, one hot spot in the West Precinct actually saw a significant increase in crashes over the enforcement trial. Officers noted that it was particularly difficult to conduct enforcement in this hot spot. The roadway was very narrow and congested, and it is possible that these factors contributed to the crash numbers. The mixed results point to the reality that not all hot spots are the same and that targeted enforcement based on the specific characteristics of each hot spot is more effective in curtailing motor vehicle incidents. Some level of local knowledge and experimentation will likely need to take place to maximize the results in multiple locations.
Discussion
In evaluating the 2019 crash reduction trial, the Metro Nashville Police Department wanted to determine if the program was effective, efficient, and fair to citizens. All three considerations are important for public officials. Initial results seem to indicate that the plan was effective in reducing crashes and efficient in reducing the amount of time officers spent on enforcement and maximizing the benefit of the enforcement. The final aspect of fairness — ensuring that any program does not unfairly target some citizens over others — is also an important factor. In 2018, the Policing Project completed “An Assessment of Traffic Stops and Policing Strategies in Nashville.” The assessment found that there were racial disparities in traffic stops in the city, particularly for those based on nonmoving violations. Additionally, it was concluded that traffic stops were not an effective strategy for reducing crime.[7]
In order to address the limitation of “fairness to citizens,” the crash reduction trial completed by the Traffic Section took great care to ensure that disparities such as those uncovered by the Policing Project were not repeated. This was accomplished in several ways. First, the hot spots were identified in seven precincts across the city. They were based solely on crash statistics; crime statistics were not considered in hot spot identification. Second, officers were told to focus on driving behaviors, specifically moving violations that typically contribute to crashes. Finally, the quality of stops was emphasized over quantity. Again, quality stops were defined as stops for the behaviors that lead to crashes. Other violations, particularly regulatory offenses that do not impact safe driving, were not emphasized. The trial was planned this way to avoid the unintended consequences of tying together traffic enforcement and crime reduction. The Policing Project’s assessment noted that Nashville’s driving-age population was 58% white, 27% Black, 9% Hispanic, and 6% other (including Asian).[8] The assessment also determined that “in 2017, the per capita stop rate was 44% higher for Black drivers than for white drivers.”[9] The racial breakdown of the drivers who were stopped during the enforcement trial was 55.5% white, 35.8% Black, 2.9% Hispanic, 1.9% Asian, and 3.9% other. As such, this study sought to maximize the effectiveness, efficiency, and fairness of the program. More analysis is necessary to determine if focusing on crash-only hot spots, independent of crime, and only those traffic violations that lead to crashes results in a more equitable distribution of traffic stops.
The two traffic initiatives undertaken in Nashville used a data-driven and evidence-based approach to reduce the social harms created by traffic crashes as well as reduce the burden that responding to crashes places on officers’ time. The initial enforcement initiative paved the way for adding to the evidence base and experimenting with new programs within the police department. Rather than simply adopting a strategy blindly, an effort was made to rigorously plan, collect data, and test different hypotheses while aiming to improve the outcomes of police services. The second initiative provided a small trial case for expanding enforcement on a consistent basis across the city. These initiatives provided the department with a springboard to continue to experiment with and refine the approach the department takes to reduce traffic crashes.
Going forward, we hope to make data-driven HVE plans a regular part of the crash-reduction strategy in the department. We hope to institutionalize the practice of data analysis, HVE waves in hot spots, and evaluation so we can proactively impact driving behaviors in the city. These two experiments have shown the need for more robust and efficient data analysis in order to more efficiently identify hot spots. Just as importantly, we see the need to identify the reasons that crashes are occurring and target those root problems. The best outcomes in traffic enforcement can be seen when you make traffic stops in the right places, at the right times, and for the right reasons. Despite law enforcement’s best efforts nationwide, traffic crashes continue to lead to over 37,000 deaths each year nationally.[10] Law enforcement will need to continue to develop strategies and provide enforcement and education to the public to reduce crashes.


