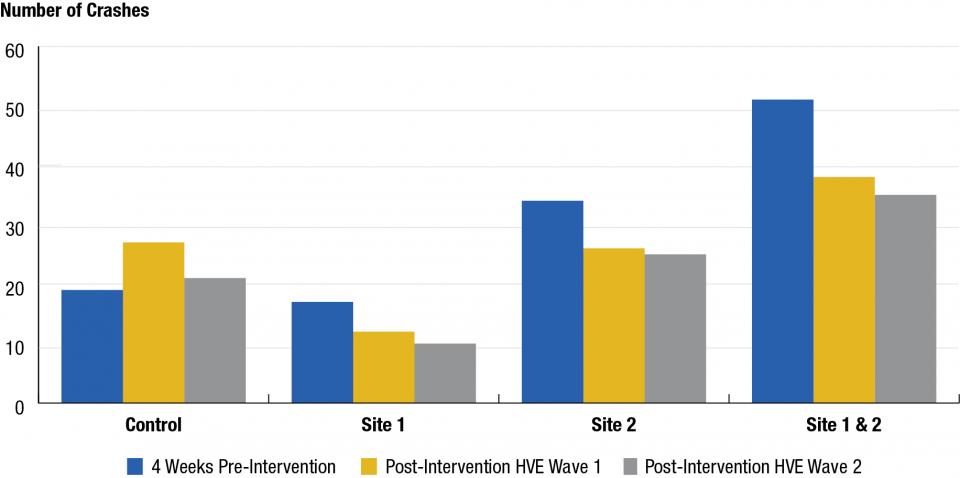
Exhibit 1: Crashes in Control and HVE Sites Pre-Intervention and After Waves 1 and 2
From the article ""Effect of High-Visibility Enforcement on Motor Vehicle Crashes," June 22, 2020.
Comparison of crash statistics four weeks before intervention and post-intervention demonstrate a 33% reduction in crashes after HVE at the target site. In contrast, the control site demonstrated a trending increase in crashes over the same period.
| Control | Site 1 | Site 2 | Site 1 & 2 | |
|---|---|---|---|---|
| 4 Weeks Pre-Intervention | 19 | 17 | 34 | 51 |
| Post-Intervention HVE Wave 1 | 27 | 12 | 26 | 38 |
| Post- Intervention HVE Wave 2 | 21 | 10 | 25 | 35 |
Source: Sgt. James Williams, Metro Nashville Police Department, "Effect of High-Visibility Enforcement on Motor Vehicle Crashes," June 22, 2020, nij.ojp.gov:
https://nij.ojp.gov/topics/articles/effect-high-visibility-enforcement-motor-vehicle-crashes


