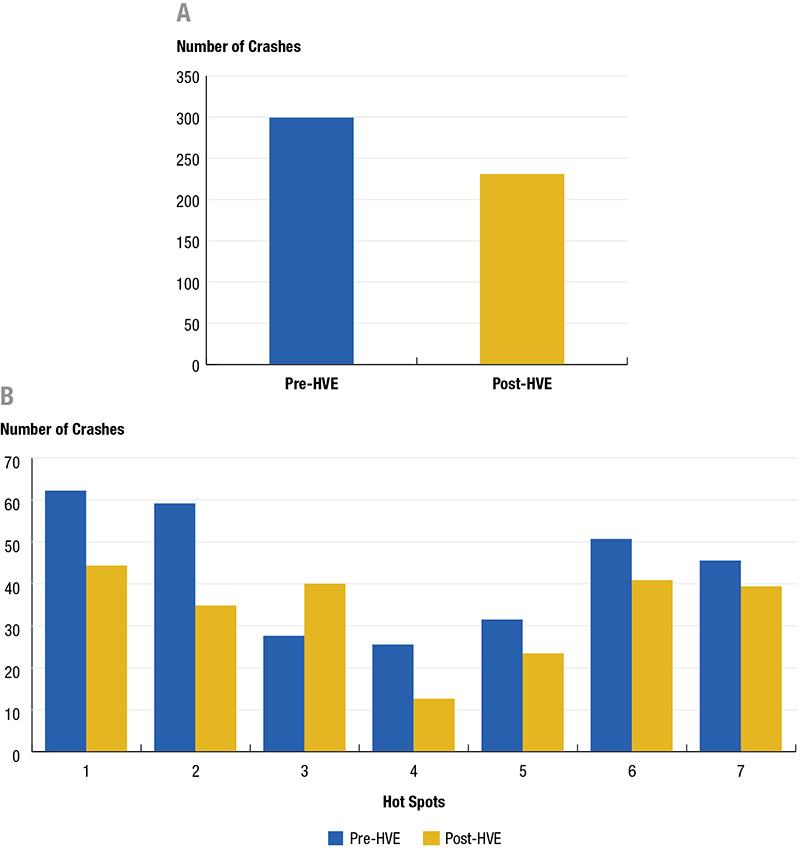
Exhibit 3: Crashes in Hot Spots Before and After High Visibility Enforcement
From the article ""Effect of High-Visibility Enforcement on Motor Vehicle Crashes," June 22, 2020.
(A) The total number of crashes declined by 22.56% from six weeks before the HVE was conducted to six weeks after the HVE was conducted. (B) The number of crashes across six hot spots declined six weeks after HVE. Only hot spot 3 demonstrated an increase in the number of crashes.
| Time Period | Crashes |
|---|---|
| 6 Weeks Before HVE | 297 |
| 6 Weeks After HVE | 230 |
| Hot Spot | 1 | 2 | 3 | 4 | 5 | 6 | 7 |
|---|---|---|---|---|---|---|---|
| Pre HVE | 61 | 58 | 27 | 25 | 31 | 50 | 45 |
| Post HVE | 43 | 34 | 39 | 12 | 23 | 40 | 39 |
Source: Sgt. James Williams, Metro Nashville Police Department, "Effect of High-Visibility Enforcement on Motor Vehicle Crashes," June 22, 2020, nij.ojp.gov:
https://nij.ojp.gov/topics/articles/effect-high-visibility-enforcement-motor-vehicle-crashes


