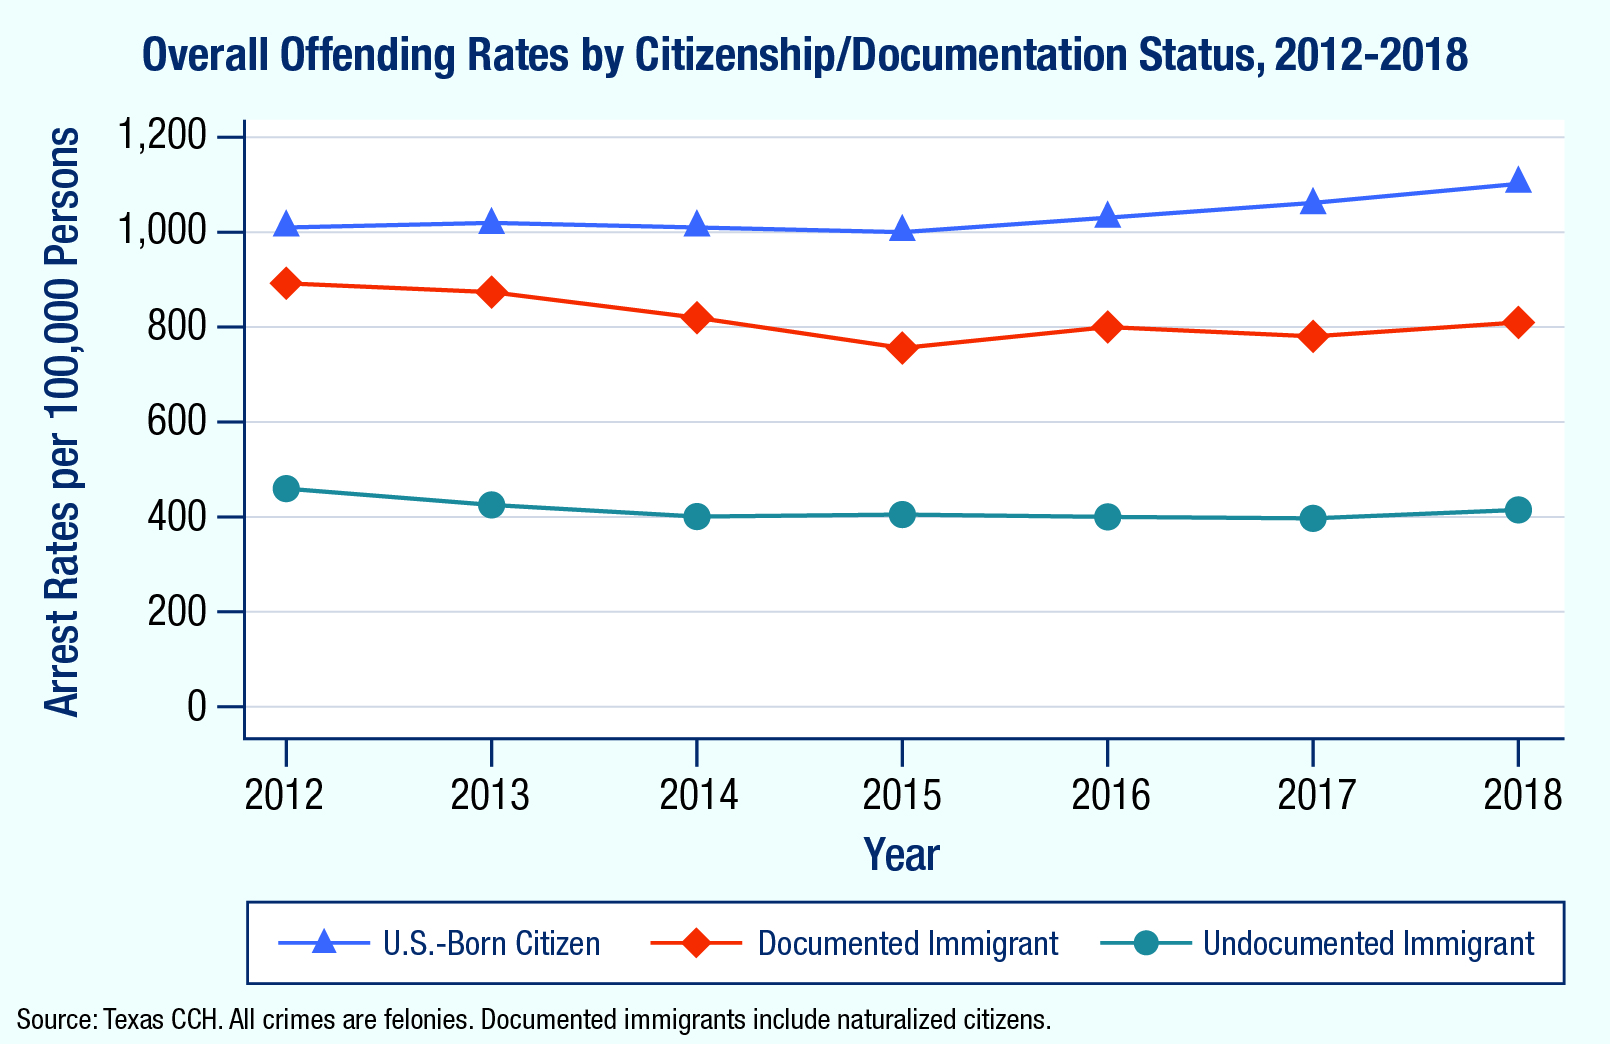
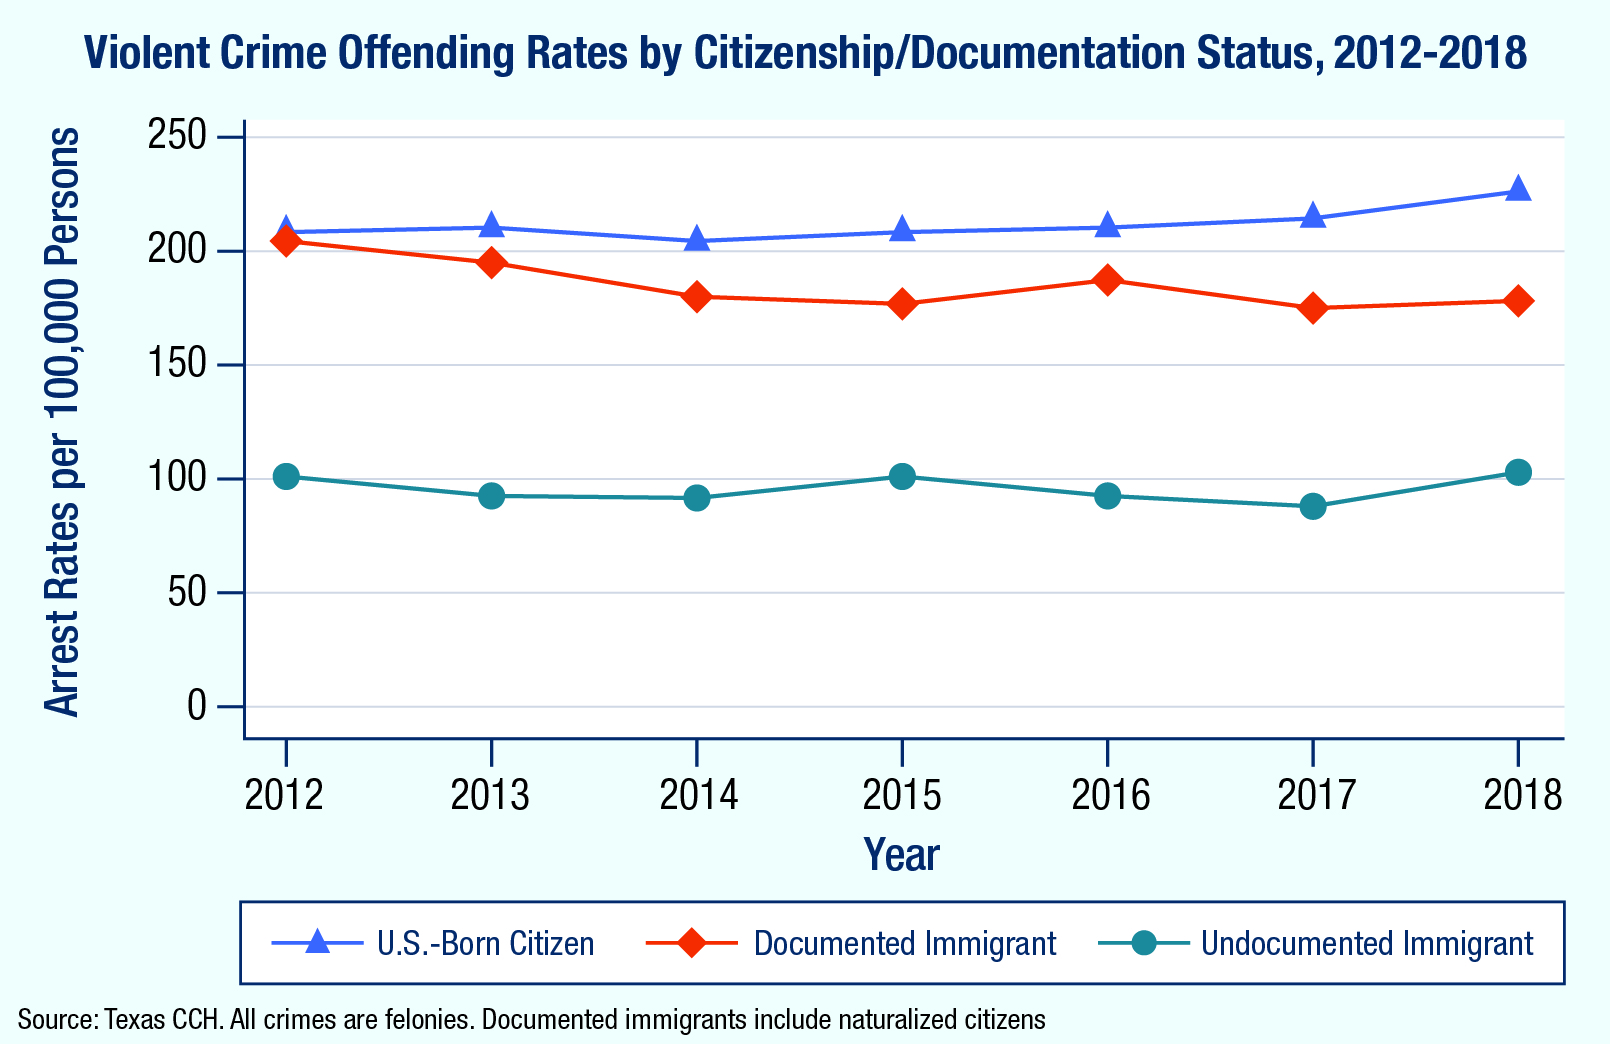
An NIJ-funded study examining data from the Texas Department of Public Safety estimated the rate at which undocumented immigrants are arrested for committing crimes. The study found that undocumented immigrants are arrested at less than half the rate of native-born U.S. citizens for violent and drug crimes and a quarter the rate of native-born citizens for property crimes.[1]
The question of how often undocumented immigrants commit crimes is not easy to answer. Most previous research on crime commission by immigrant populations has been unable to differentiate undocumented immigrants from documented immigrants. As a result, most studies treat all immigrants as a uniform group, regardless of whether they are in the country legally.
The estimates in this study come from Texas criminal records that include the immigration status of everyone arrested in the state from 2012 to 2018. These data enabled researchers to separate arrests for crimes committed by undocumented immigrants from those committed by documented immigrants and native-born U.S. citizens. (For more detail on the study’s data sources and methodology, see the sidebar “What Makes the Texas Data Unique?”)
The researchers tracked these three groups’ arrest rates across seven years (2012-2018) and examined specific types of crime, including homicides and other violent crimes.[2] They used these arrest rates as proxies for the rates of crime commission for the three groups. It should be noted that arrest is a commonly used, but imperfect measure of crime that in part reflects law enforcement activity rather than actual offending rates.
During this time, undocumented immigrants had the lowest offending rates overall for both total felony crime (see exhibit 1) and violent felony crime (see exhibit 2) compared to other groups. U.S.-born citizens had the highest offending rates overall for most crime types, with documented immigrants generally falling between the other two groups.
Exhibit 1.Total felony crime offending rates in Texas for U.S.-born citizens, documented immigrants, and undocumented immigrants
Exhibit 2.Violent felony crime offending rates in Texas for U.S.-born citizens, documented immigrants, and undocumented immigrants
Researchers also looked specifically at homicide arrest trends. These rates tend to fluctuate more than the overall violent crime arrest rates because murders are relatively rare compared to other crimes. In addition, a large share of homicides go unsolved. Still, undocumented immigrants had the lowest homicide arrest rates throughout the entire study period, averaging less than half the rate at which U.S.-born citizens were arrested for homicide.[3] (The homicide rate for documented immigrants fluctuated. Sometimes it was higher than the rate for U.S.-born citizens and sometimes it was lower.)
Every other violent and property crime type the researchers examined followed the same general pattern. The offending rates of undocumented immigrants were consistently lower than both U.S.-born citizens and documented immigrants for assault, sexual assault, robbery, burglary, theft, and arson.
For drug offenses, too, undocumented immigrants were less than half as likely to be arrested as native-born U.S. citizens.[4] Moreover, the drug crime arrest rate for the undocumented population held steady throughout the seven years of data, while the rate for native-born citizens increased almost 30% during that time. As a result, undocumented immigrants had a smaller share of arrests for drug crimes in 2018 than they had in 2012.
Finally, the researchers conducted statistical tests to determine whether the share of crimes committed by undocumented immigrants had increased for any offense types between 2012 and 2018. They concluded, “There is no evidence that the prevalence of undocumented immigrant crime has grown for any category.”[5] As with drug offenses, evidence suggests the share of property and traffic crimes committed by undocumented immigrants decreased or remained close to constant throughout the period.
About This Article
The work described in this article was supported by NIJ award number 2019-R2-CX-0058, awarded to the University of Wisconsin.
This article is based on the grantee report, “Unauthorized Immigration, Crime, and Recidivism: Evidence From Texas” (pdf, 78 pages), by Michael T. Light.
Sidebar: What Makes the Texas Data Unique?
Calculating offending rates for a specific group is usually a simple operation: First count the number of arrests in that group, then divide by the group’s total number of people. For undocumented immigrants, however, both numbers have been difficult to estimate in the past.
To count the total number of undocumented immigrants in Texas (i.e., the denominator of the offense rate), this study used data from the Center for Migration Studies, which the authors called “one of the most reliable, respected, and peer-reviewed sources on the undocumented immigrant population.”[6]
But the real innovation of this study was in counting the number of arrests within Texas’s undocumented population (i.e., the numerator of the offense rate). To find that number, the study relied on a unique feature of the state’s legal system. When a Texas law enforcement agency arrests someone, they are legally required to look up that person’s place of birth and citizenship. To do that, agencies send the person’s fingerprints to the U.S. Department of Homeland Security (DHS), which reports the person’s immigration status. This status becomes part of any criminal record in Texas.
As the study’s authors write, “To our knowledge, Texas is the only state that requires the determination and documentation of immigration status as part of its standard criminal justice records practice. …Simply put, no other data source in the United States could accomplish this task with the same degree of breadth, rigor, and detail.”[7]
Examining only the overall immigrant offending rate (i.e., documented and undocumented immigrants combined) obscures meaningful differences between these two groups. Because of the unique nature of Texas’s arrest records, the authors could reliably separate arrests of undocumented immigrants from those of documented immigrants (including naturalized U.S. citizens).[8] Disentangling the groups’ arrest records gave the study an unprecedented window into how their offending patterns differ from each other and from those of U.S.-born individuals. Future research should explore whether these findings are replicated in other states and localities, including those with different shares of immigrant populations and variations in immigration enforcement policies.[9]


