Introduction
Recidivism is a major concern for our criminal justice system. Although our ability to predict recidivism through risk and needs assessments has improved, many tools used for prediction and forecasting are insensitive to gender-specific needs and suffer from racial bias.[1] In addressing these issues, the National Institute of Justice (NIJ) recently hosted the Recidivism Forecasting Challenge. The primary aim of this research competition was to understand the factors that drive recidivism, which was measured by an arrest for a new offense. Challenge entrants were asked to develop and train software models to forecast recidivism for individuals released on parole from the state of Georgia. Entrants were given a dataset that allowed them to train their forecasting models by exploring gender, racial and age differences for individuals on parole, in addition to a host of other information. Submissions showed how data sharing and open competition can improve recidivism forecasting accuracy compared to simple forecasting models.
Data sharing and open competition
NIJ science staff, along with colleagues from the Bureau of Justice Assistance and the Bureau of Justice Statistics, worked closely with the Georgia Department of Community Supervision for this Challenge. The Georgia Department of Community Supervision initially was identified as a partner on the strength of prior state-funded investments that improved the breadth of their data collection and sharing capabilities. Capitalizing on these improvements, the Challenge provided the public with open data access, making it possible for a diverse pool of entrants to compete in the Challenge. The Challenge attracted over 70 teams with a wide variety of expertise and access to resources.
Traditionally, data about individuals in custody and under supervision are held in silos where access is limited to internal institutional and community corrections administration, or formal research partnerships and agreements. This can be problematic because institutional and community corrections institutions may not have the resources to look at this data, and formal research partnerships limit the potential diversity of expertise and individuals evaluating the data. To help expand access to data and expertise, the Challenge both assisted in making data widely available and gave the Georgia Department of Community Supervision the opportunity to benefit from a greater number and variety of research insights.
Challenge design and judging criteria
Three rounds of competition were administered, with entrants asked to forecast the probability of recidivism for male and female individuals within their first, second and third years on parole. For each round, forecasts were judged by two criteria: accuracy and fairness. Accuracy of recidivism forecasts for each submission was scored for male individuals, female individuals and the average of those two scores. Forecast accuracy was measured by comparing the forecasted probability of recidivism for each individual in the dataset to their actual outcome. An error measurement was calculated for each forecast to compare model accuracies. For this score, the lower the value — or the less error — the more accurate the model.
The second judging criterion, the fairness of a recidivism forecast, took into account racial differences in false-positive rates between Black and white individuals, and fairness was scored separately for males and females. (The dataset used in the Challenge included only Black and white individuals because there were so few individuals of other races that including them would have run the risk of disclosing their identities). In evaluating the fairness and accuracy of forecasts, NIJ penalized their accuracy scores to reflect racial differences in false-positive rates. For these forecasts, a false positive occurs when an individual is forecasted to recidivate (with a probability greater than or equal to 50%), when in fact they do not recidivate.
This measurement of fairness was selected because being incorrectly identified as at high risk for recidivism can lead to excessive supervision (for example, additional supervision or service requirements), which has been linked to negative outcomes for those under supervision.[2] Assigning excessive supervision requirements may also result in more time-consuming caseloads for case managers and fewer supervision resources for those who may actually benefit from additional supervision services.
The winners and their individual scores can be found on NIJ’s Recidivism Forecasting Challenge webpage along with a more detailed overview of the Challenge, the variables in the dataset, and the methods used to judge the entries.[3]
Models and methods used for contextualizing and comparison
To put the winning forecasts into context, we compared their accuracy to a set of simple prediction models. The simplest model for determining who is likely to recidivate within the next year is to assign everyone a 50% (random chance) probability. This likelihood is equivalent to flipping a coin for every person: heads they recidivate in the next year; tails they do not. In addition to comparing forecasts to the random chance model, NIJ used the dataset to create several simple demographic models to forecast recidivism. Those models considered probability of recidivism based on someone’s race, age, gender, or a combination of the three. These simple, “naive” models provided a standard beyond random chance for comparing how well the winning forecasts performed. For more details on contextualizing the findings, descriptions of error scores, and how they are calculated, and the probabilities for each of the naïve models, see the full report.[4]
Results
Accuracy winning models
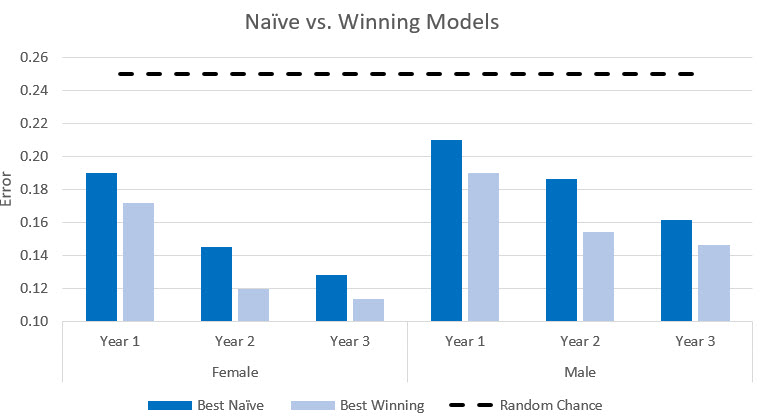
Overall, winning models were more accurate than random chance and the best naïve models. The accuracy of models improved as the years progressed, as shown in Exhibit 1. This trend is consistent across naïve models and winning models for both females and males.
Fairness and accuracy prize winners
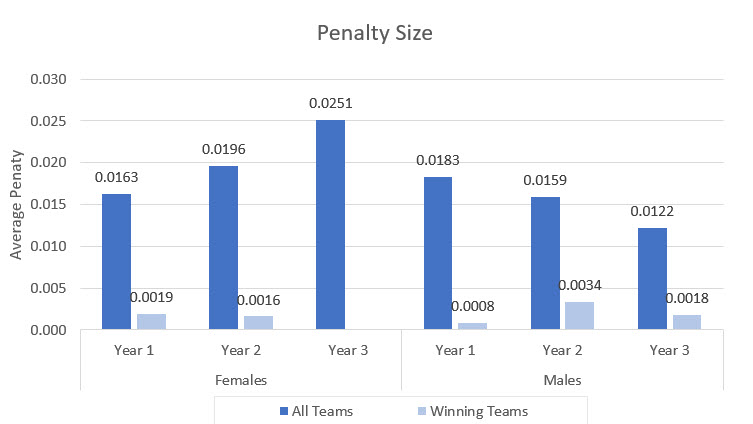
The fairness and accuracy prize incorporated a penalty based on the racial difference in false positive accuracy scores were reduced when submissions incorrectly forecasted Black or white individuals to recidivate at a higher rate. Exhibit 2 presents the average penalty of submissions that received a fairness penalty for their forecasts of males and females, across years. Across all entries that received a fairness penalty, the penalty increased for females as the years progressed, but the opposite was true for males. This suggests factors that contribute to racial bias in predicting recidivism do not affect males and females in the same way. The winning submissions had lower or no penalties when predicting recidivism for females across the years, but there was no clear trend for winners’ penalties when predicting recidivism among males.
Conclusion and potential next steps
The winning forecasts performed substantially better than random chance and naïve demographic models. The differences in accuracy between the winning and naïve models are likely attributed to the utilization of more advanced statistical techniques (for example, regression, random forest, neural networks) and incorporation of additional data from the Georgia Department of Community Supervision beyond the demographics used in the naïve models.
Fairness and accuracy scores were also compared based on the frequency and magnitude of the fairness penalty. Penalties were observed across the winning submissions, although they were considerably smaller than the average penalty size. This suggests as the accuracies of models improved, so did model fairness. Interestingly, although most models received fairness penalties, race alone was not identified as a significant indicator of recidivism. This result, as well as the increase in penalty size for females across years, will be evaluated in future research. Further exploration is needed to better understand how this fairness was reflected in the Challenge and what implications these fairness results have for the field.
The successful completion and initial review of the results from the Challenge demonstrate the value of open data and open competition approaches for facilitating research within departments of corrections or community supervision. Further examination is needed to:
- Identify and understand gender differences in risk assessments and the support provided for these individuals while under community supervision.
- Unpack penalty scores and understand the proper balance between fair and accurate forecasts.
NIJ intends to address these research questions along with practical implications of the Challenge, discussing the balance between improved precision and practical improvement, and a meta-analysis of the relevant variables and modeling techniques identified by winners in future reports and articles.
With the Challenge concluded, NIJ is seeking to encourage discussion on reentry, bias, fairness, measurement and algorithm advancement.
Papers from the Winners
As a condition of receiving their prize, each winner was asked to submit a research paper that describes which variables did and did not matter to the final forecasting model, and when applicable, what type of models outperformed other models. Following are links to each submitted paper:
- Recidivism Forecasting with Multi-Target Ensembles: Winning Solution for Male, Female, and Overall Categories in Year One, Team CrimeFree
- Recidivism Forecasting Using XGBoost
- Recidivism Forecasting Challenge: Team IdleSpeculation Report
- Predicting Recidivism Fairly: A Machine Learning Application Using Contextual and Individual Data
- National Institute of Justice’s Forecasting Recidivism Challenge: Team “DEAP” (Final Report)
- Predicting Recidivism with Neural Network Models
- Predicting Criminal Recidivism Using Specialized Feature Engineering and XGBoost
- NIJ Recidivism Challenge Report, Team Klus
- National Institute of Justice’s Recidivism Forecasting Challenge, SRLLC
- NIJ Recidivism Forecasting Challenge Report for Team PASDA
- Recidivism Forecasting Challenge
- Team MattMarifelSora: NIJ Recidivism Forecasting Challenge Report
- National Institute of Justice's Recidivism Forecasting Challenge: Research Paper, Group MNLB
- NIJ Report, Team VT-ISE
- Recidivism Forecasting with Multi-Target Ensembles: Years One, Two and Three
- Predicting Recidivism in Georgia Using Lasso Regression Models with Several New Constructs
- National Institute of Justice Recidivism Forecasting Challenge: Team “MCHawks” Performance Analysis
- See also the article "An Open Source Replication of a Winning Recidivism Prediction Model" published in the International Journal of Offender Therapy and Comparative Criminology.
- NIJ Recidivism Challenge Report: Team Smith
- Skynet is Alive and Well: Leveraging a Neural Net to Predict Felon Recidivism
- National Institute of Justice Recidivism Challenge Report: Team Aurors
- Forecasting Recidivism: Mission Impossible
- Report on NIJ Recidivism Forecasting Challenge
- Accounting for Racial Bias in Recidivism Forecasting, Year 3 Male Parolees Report, SAS Institute Inc. Team
- DataRobot Model
- CATBOOST Models for the Recidivism Forecasting Challenge
- NIJ Recidivism Challenge, 2021, Team Early Stopping, Years 2 and 3
Acknowledgments
NIJ would like to acknowledge its partners at the Georgia Department of Community Supervision for providing the dataset; NIJ staff that assisted with the Challenge who are not authors of this paper; our colleagues at the Bureau of Justice Statistics and Bureau of Justice Assistance for their assistance in developing the Challenge; Dr. Tammy Meredith, who was brought on as a contracted subject matter expert; and to all those who submitted entries to the Challenge for their participation.


