Naïve vs. Winning Models
From "Results from the National Institute of Justice Recidivism Forecasting Challenge."
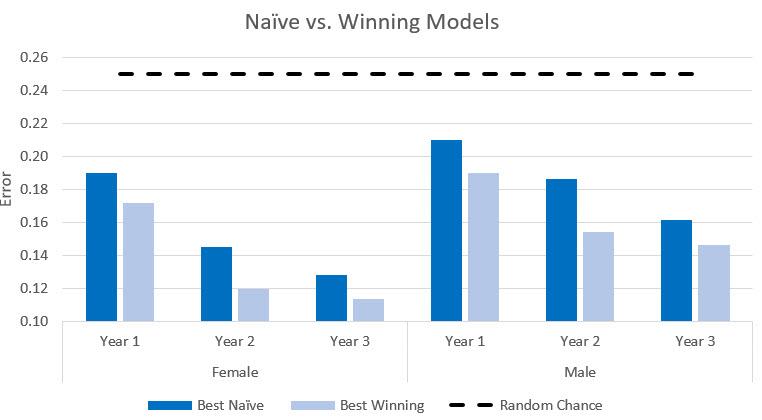
Exhibit 1: Naïve vs. Winning Models. Top winning scores are presented to display the range of scores across years and specifically how top winner’s scores compare to simple demographic and chance models. Both naïve and winning models performed substantially better (error is lower) than the random chance model (dotted line).
Data
| Year 1 | Year 2 | Year 3 | |
|---|---|---|---|
| Random Chance | 0.25000 | 0.25000 | 0.25000 |
| Best Naïve | 0.19015 | 0.14506 | 0.12811 |
| Best Winning | 0.17190 | 0.11960 | 0.11390 |
| Year 1 | Year 2 | Year 3 | |
|---|---|---|---|
| Random Chance | 0.25000 | 0.25000 | 0.25000 |
| Best Naïve | 0.21001 | 0.18647 | 0.16163 |
| Best Winning | 0.19000 | 0.15420 | 0.14630 |


