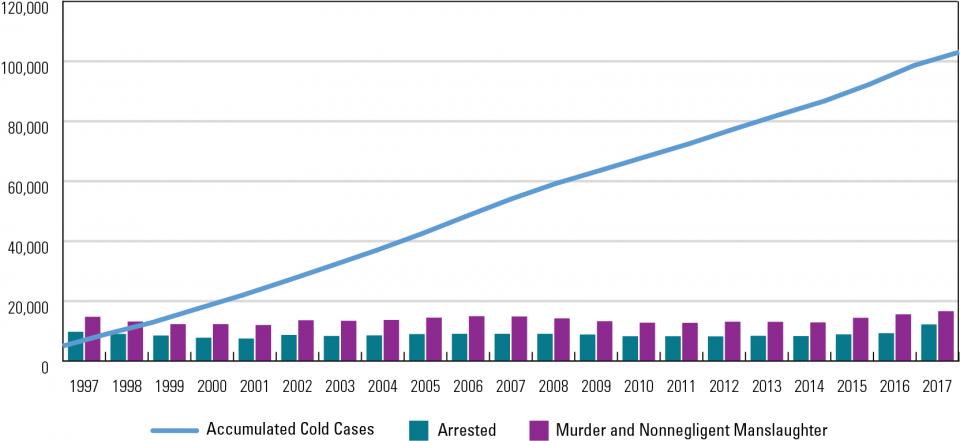
Exhibit 1: Accumulated Cold Cases, 1997-2017
From the article "Serial Killer Connections Through Cold Cases," June 15, 2020.
| Year | Cases of Murder and Nonnegligent Manslaughter | Percentage Cleared by Arrest | Arrested | Cold Cases |
|---|---|---|---|---|
|
1997 |
14,759 |
66.1% |
9,756 |
5,003 |
|
1998 |
13,134 |
68.7% |
9,023 |
4,111 |
|
1999 |
12,266 |
69.1% |
8,476 |
3,790 |
|
2000 |
12,291 |
63.1% |
7,756 |
4,535 |
|
2001 |
11,982 |
62.4% |
7,477 |
4,505 |
|
2002 |
13,561 |
64.0% |
8,679 |
4,882 |
|
2003 |
13,373 |
62.4% |
8,345 |
5,028 |
|
2004 |
13,662 |
62.6% |
8,552 |
5,110 |
|
2005 |
14,430 |
62.1% |
8,961 |
5,469 |
|
2006 |
14,948 |
60.7% |
9,073 |
5,875 |
|
2007 |
14,811 |
61.2% |
9,064 |
5,747 |
|
2008 |
14,225 |
63.6% |
9,047 |
5,178 |
|
2009 |
13,242 |
66.6% |
8,819 |
4,423 |
|
2010 |
12,760 |
64.8% |
8,268 |
4,492 |
|
2011 |
12,706 |
64.8% |
8,233 |
4,473 |
|
2012 |
13,092 |
62.5% |
8,183 |
4,910 |
|
2013 |
13,075 |
64.1% |
8,381 |
4,694 |
|
2014 |
12,879 |
64.5% |
8,307 |
4,572 |
|
2015 |
14,392 |
61.5% |
8,851 |
5,541 |
|
2016 |
15,556 |
59.4% |
9,240 |
6,316 |
|
2017 |
16,617 |
61.6% |
12,208 |
4,409 |
|
TOTAL |
287,761 |
184,700 |
103,061 |
Source: Information surmised by calculating the number of homicides reported to the FBI since 1980 minus the total number of homicide cases reported to have been cleared.


