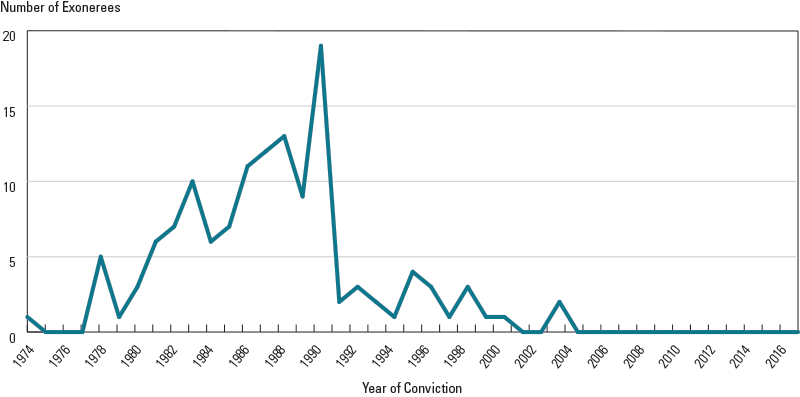
Figure 1: Number of Exonerees by Year of Conviction
Figure 1 is a line graph showing the number of exonerations from 1974 through 2003 in which the National Registry of Exonerations cites forensic science as a contributing factor.
The data points shown on the line graph are as follows:
| Year of Conviction | Number of Exonerees |
|---|---|
| 1974 | 1 |
| 1975 | 0 |
| 1976 | 0 |
| 1977 | 0 |
| 1978 | 5 |
| 1979 | 1 |
| 1980 | 3 |
| 1981 | 6 |
| 1982 | 7 |
| 1983 | 10 |
| 1984 | 6 |
| 1985 | 7 |
| 1986 | 11 |
| 1987 | 12 |
| 1988 | 13 |
| 1989 | 9 |
| 1990 | 19 |
| 1991 | 2 |
| 1992 | 3 |
| 1993 | 2 |
| 1994 | 1 |
| 1995 | 4 |
| 1996 | 3 |
| 1997 | 1 |
| 1998 | 3 |
| 1999 | 1 |
| 2000 | 1 |
| 2001 | 0 |
| 2002 | 0 |
| 2003 | 2 |
| 2004 | 0 |
| 2005 | 0 |
| 2006 | 0 |
| 2007 | 0 |
| 2008 | 0 |
| 2009 | 0 |
| 2010 | 0 |
| 2011 | 0 |
| 2012 | 0 |
| 2013 | 0 |
| 2014 | 0 |
| 2015 | 0 |
| 2016 | 0 |
|
Total |
133 |
Data are based on 133 cases of wrongful conviction listed by the National Registry of Exonerations.


