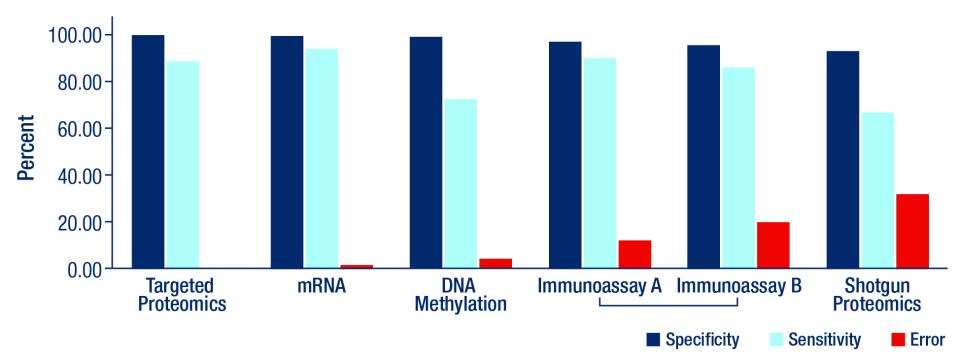
Figure 1. Comparison of specificity, sensitivity, and error rates of the body fluid identification assays
Description
This image is figure 1 in the article Direct Comparison of Body Fluid Identification Technologies.
| Assay / Formula | Specificity TN/(TN+FP) | Sensitivity TP/(TP+FN) | % error FP/(FP+TP) |
|---|---|---|---|
| Targeted Proteomics | 100.0 | 88.5 | 0.0 |
| mRNA | 99.7 | 94.1 | 1.5 |
| DNA Methylation | 99.5 | 72.5 | 3.8 |
| Immunoassay A | 97.1 | 89.2 | 12.1 |
| Immunoassay B | 95.4 | 85.1 | 19.7 |
| Shotgun Proteomics | 93.4 | 67.7 | 32.3 |


