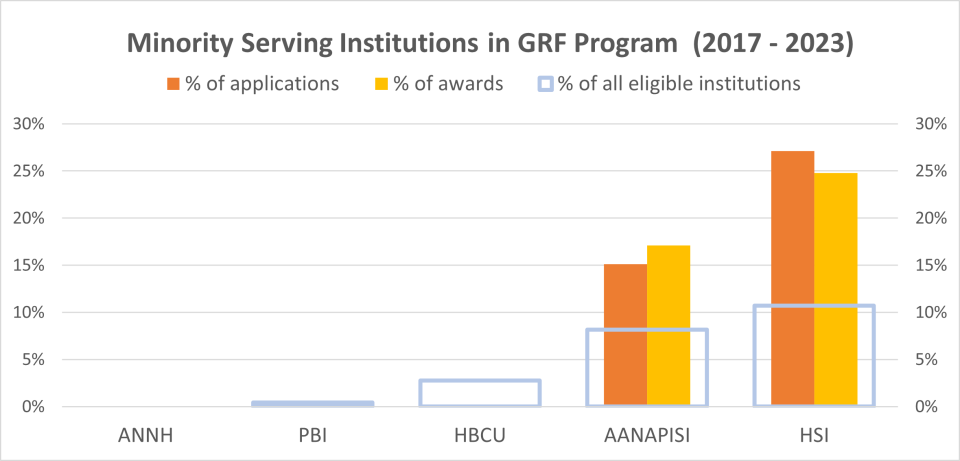
Minority Serving Institutions in GRF Program (2017-2023)
Description
| Insitution Type | Percent of Applications | Percent of Awards | Percent of All Eligible Institutions |
|---|---|---|---|
| Alaska Native- and Native Hawaiian-Serving Institutions | 0.0% | 0.0% | 0.0% |
| Predominately Black institutions | 0.4% | 0.0% | 0.4% |
| Historically Black Colleges and Universities | 0.0% | 0.0% | 2.8% |
| Asian American and American Pacific Islander-Serving Institutions | 15.3% | 18.0% | 8.2% |
| Hispanic Serving Institutions | 27.8% | 28.1% | 10.7% |


