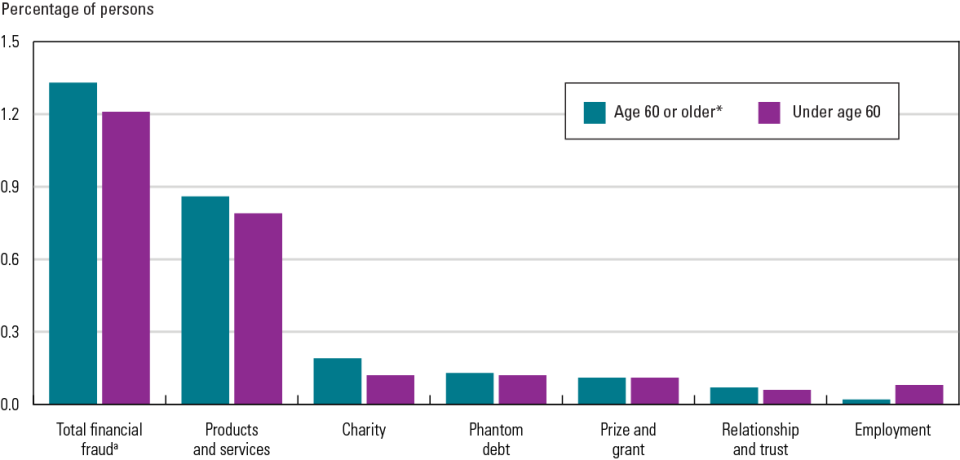
Exhibit 1. Percentage of persons who experienced at least one incident of personal financial fraud in the past 12 months, by type of fraud and age of person, 2017.
This image is exhibit 1 in the NIJ Journal article "Examining Financial Fraud Against Older Adults."
| Type of fraud | Estimate of persons age 60 or older* | Estimate of persons under age 60 |
|---|---|---|
| Total financial frauda | 1.33% | 1.21% |
| Products and services | 0.86% | 0.79% |
| Charity | 0.19% | 0.12% |
| Phantom debt | 0.13% | 0.12% |
| Prize and grant | 0.11% | 0.11% |
| Relationship and trust | 0.07% | 0.06% |
| Employment | 0.02% | 0.08% |
Note: Estimates are based on the most recent incident for that fraud type.
* Comparison group.
a Consumer investment fraud is excluded from this table due to too few sample cases but is included in total financial fraud.
Source: Bureau of Justice Statistics, National Crime Victimization Survey, Supplemental Fraud Survey, 2017.


