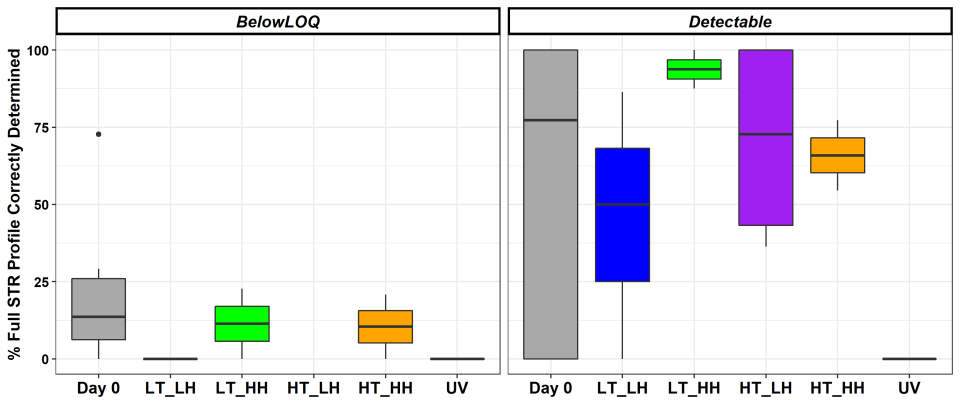
Figure 3: Percentage of complete STR profiles determined for touch DNA samples exposed to different environmental conditions
This image is Figure 3 from the article Persistence of Touch DNA for Analysis.
Figure 3: Percentage of complete STR profiles determined for touch DNA samples exposed to different environmental conditions. Results are shown separately for samples with DNA quantities below the limit of quantitation (LOQ) for the assay and for those that are above the LOQ (detectable). Touch DNA samples were exposed to the temperature/humidity combinations for seven days. The UV light exposure was one day.
The following numbers of samples were included in the analysis. For below LOQ samples: day zero (n=7), LT-LH (n=1), LT-HH (n=2), HT-LH (n=0), HT-HH (n=2), UV (n=2). For detectable samples: day zero (n=13), LT-LH (n=3), LT-LH (n=2), HT-LH (n=4), HT-HH (n=2), UV (n=1).


