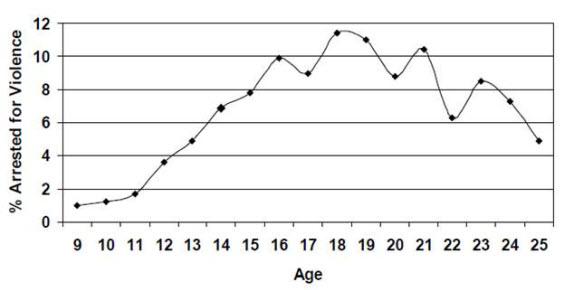
Figure 1: An example of an age-crime curve
From the article "From Youth Justice Involvement to Young Adult Offending," March 10, 2014.
This example of the age-crime curve shows the number of arrests for violence increasing from ages 11-19 and then generally decreasing through age 25 with spikes at 21 and 23.
Source: Loeber, Rolf, and Rebecca Stallings, “Modeling the Impact of Interventions on Local Indicators of Offending, Victimization, and Incarceration,” in Young Homicide Offenders and Victims: Risk Factors, Prediction, and Prevention from Childhood, eds. Rolf Loeber and David P. Farrington, New York: Springer, 2011: 137-152.


