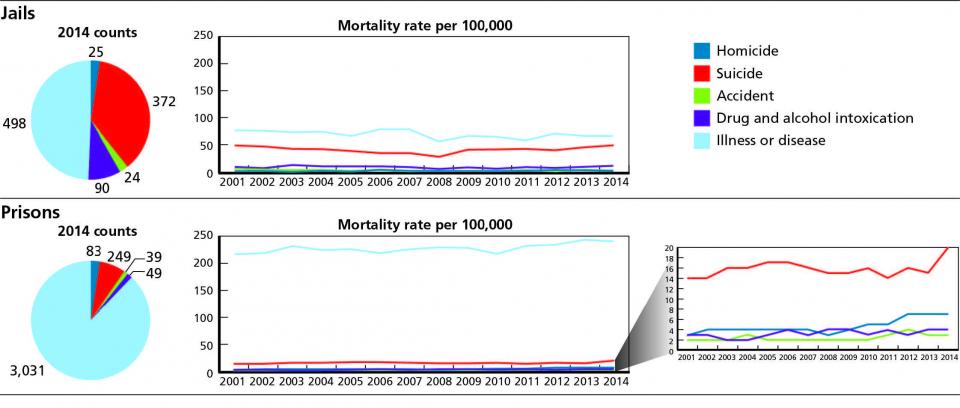
2014 Bureau of Justice Statistics data on distribution of mortality types in jails and state prisons, and long-term trends in mortality rates
2014 Bureau of Justice Statistics data on distribution of mortality types in jails and state prisons, and long-term trends in mortality rates.
Source: Noonan, M., Mortality in Local Jails, 2000–2014—Statistical Tables, Washington, D.C.: Bureau of Justice Statistics, NCJ 250169, December 2016a; Noonan, M., Mortality in State Prisons, 2000–2014—Statistical Tables, Washington, D.C.: Bureau of Justice Statistics, NCJ 250150, December 2016b.
Note: Pie charts show the number of deaths from each mode recorded in 2014 by the Bureau of Justice Statistics. Line graphs show the incidence rate for each type of mortality per 100,000 inmates.
Source: BJS data. Figure does not include deaths that occurred in federal prisons (444) that are not categorized by mortality type and deaths that occurred in jails (44) or state prisons (32) for which the cause was categorized as missing/other.


