Figure 1: DNA Casework: Supply, Demand, Backlogs
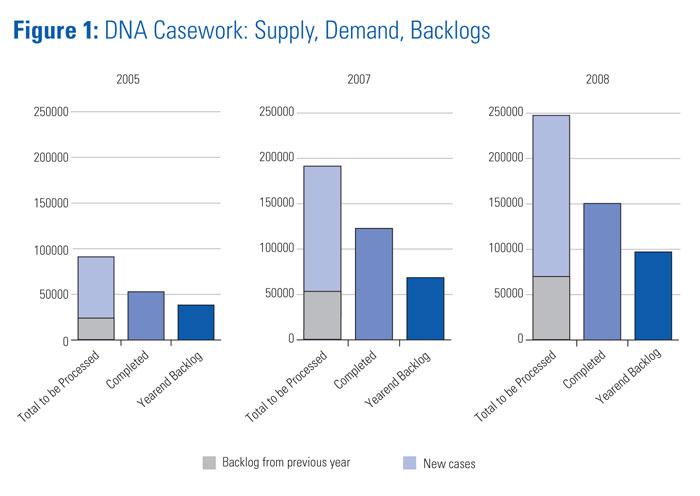
This figure graphs DNA casework in 2005, 2007, and 2008. The graph for each year displays total cases to be processed, combined with the previous year's backlog; the number of cases completed that year; and the yearend backlog. From the beginning of 2005 through the end of 2008, the total DNA cases to be processed increased by almost 150,000, but DNA laboratories were only able to increase their capacity to meet about 45% of that demand. Thus, the number of yearend backlog cases increased from about 30,000 in 2005 to nearly 95,000 in 2008.
The federal funding made available through the DNA Initiative has helped state and local governments increase the capacity of their DNA laboratories and decrease backlogs. Without the funds to purchase automated workstations and high-throughput instruments, hire new personnel, and validate procedures that are more efficient, the backlog problem would be much worse. Capacity has yet to reach the increased demand for this testing. Until demand is met, there will continue to be backlogs.
The 2005 graph is based on information from the BJS report "Census of Publicly Funded Forensic Crime Laboratories." In that report, 124 of 187 laboratories that self-identified as handling forensic DNA contributed data. The 2007 graph is based on data reported by 153 of 154 laboratories in the study "2007 DNA Evidence and Offender Analysis Measurement: DNA Backlogs, Capacity and Funding." Data for 2008, reported by applicants for NIJ's 2009 DNA Backlog Reduction Program, came from 109 applicants representing 160 DNA laboratories. (State laboratory systems with multiple DNA laboratories or consortium applications representing more than one laboratory were asked to provide data for all laboratories included in the application.)
Yearend backlog numbers were computed from the information reported by laboratories: the number of cases they had at the beginning of the year plus the number of new requests they received during that year minus the number of those requests that were completed that year.
Sources:
2005–Durose, Matthew R., Census of Publicly Funded Forensic Crime Laboratories, 2005, Washington, DC: US Department of Justice, July 2008, NCJ 222181.
2007–National Forensic Science Technology Center, "2007 DNA Evidence and Offender Analysis Measurement: DNA Backlogs, Capacity and Funding (pdf, 32 pages)," TDB final report to NIJ from grant 2006-MU-BX-K002, January 2010, NCJ 230328.
2008–2009 grant applications to DNA Backlog Reduction Program, National Institute of Justice.


