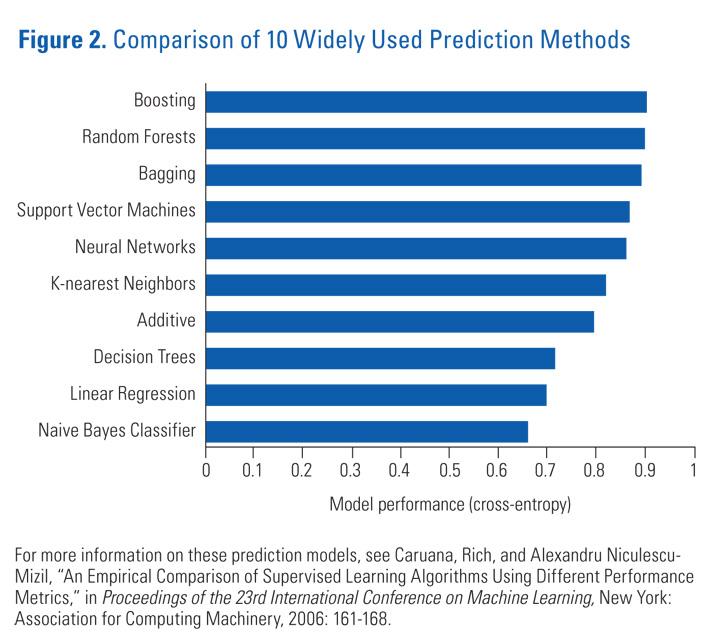
Figure 2: Comparison of 10 Widely Used Prediction Methods
| Method | Model performance (cross-entropy) |
|---|---|
| Boosting | 0.896 |
| Random Forests | 0.892 |
| Bagging | 0.882 |
| Support Vector Machines | 0.862 |
| Neural Networks | 0.846 |
| K-nearest Neighbors | 0.815 |
| Additive | 0.791 |
| Decision Trees | 0.706 |
| Linear Regression | 0.685 |
| Naive Bayes Classifier | 0.650 |
For more information on these prediction models, see Caruana, Rich, and Alexandru Niculescu-Mizil, "An Empirical Comparison of Supervised Learning Algorithms Using Different Performance Metrics," in Proceedings of the 23rd International Conference on Machine Learning, New York: Association for Computing Machinery, 2006: 161–168.


