Vehicle Burglaries — Targeted Enforcement Using Weighted Hotspots
The following description was submitted by the entrant:
Given scarce policing resources and a move towards working smarter with innovative tools and analytics, the Crime Analysis Unit at City of Riverside is providing information to support targeted policing strategies. One of the methods developed is the use of weighted hotspots derived from previous year crime data to identify "Hot" specific locations and "Hot" address blocks. Specifically, vehicle burglary crime type is used to illustrate the method.
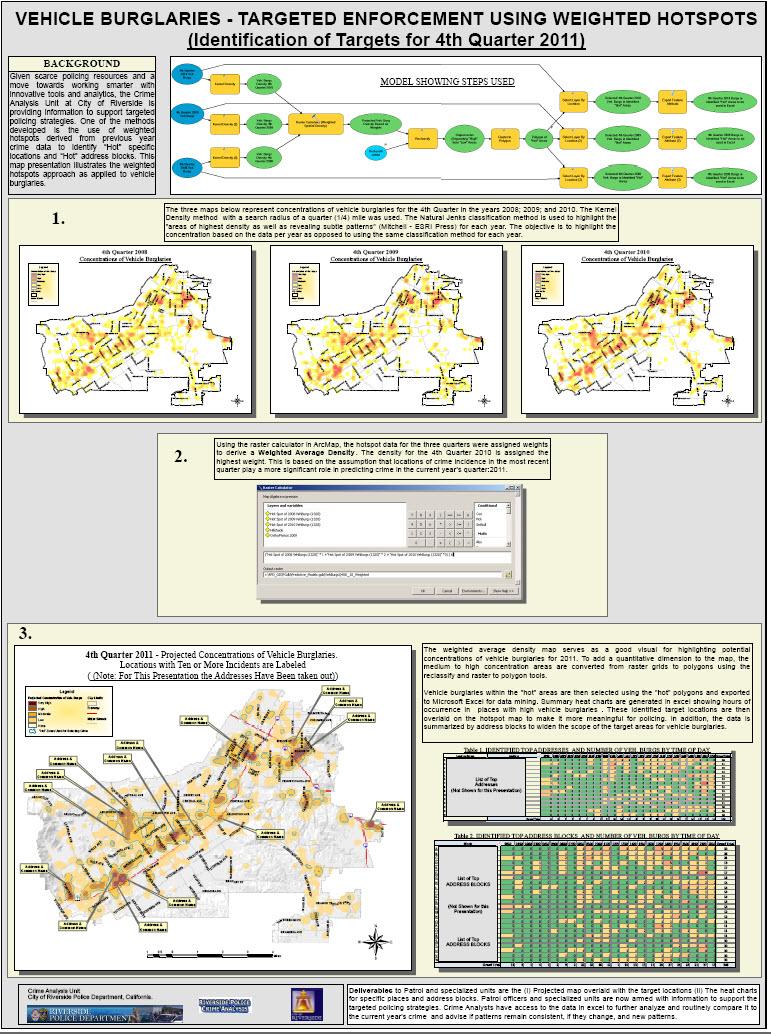
Densities of vehicle burglaries for the 4th Quarter in the years 2008, 2009, and 2010 are generated using the Kernel Density method with a search radius of a quarter (1/4) mile. The Natural Jenks classification method is used to highlight the "areas of highest density as well as revealing subtle patterns" (Mitchell - ESRI Press) for each year. The objective is to highlight the concentration based on the data per year as opposed to using the same classification method for each year.
Using the raster calculator in ArcMap, the hotspot data for the three quarters were assigned weights to derive a "Weighted Average Density." The density for the 4th Quarter 2010 is assigned the highest weight. This is based on the assumption that locations of crime incidence in the most recent quarter play a more significant role in predicting crime for the forecast quarter.
The weighted average density map serves as a good visual for highlighting potential concentrations of vehicle burglaries for 2011. To add a quantitative dimension to the map, the medium to high concentration areas are converted from raster grids to polygons using the reclassify and raster to polygon tools.
Vehicle burglaries within the "hot" areas are then selected using the "hot" polygons and exported to Microsoft Excel for data mining. Summary heat charts are generated in excel showing hours of occurrence in places with high vehicle burglaries. These identified target locations are then overlaid on the hotspot map to make it more meaningful for policing. In addition, the data is summarized by address blocks to widen the scope of the target areas for vehicle burglaries.
Deliverables to Patrol and specialized units are (i) The map showing the weighted density overlaid with the target locations, and (ii) The heat charts for specific places and address blocks. Patrol officers and specialized units are now armed with information to support the targeted policing strategies. In addition, Crime Analysts have access to the data in excel to further analyze and routinely compare it to the current year's crime and advise if patterns remain consistent; if they change; and if new patterns emerge.


