Mapping 'In-Transit' Crime Incidents on the Melbourne Railway Network
The following description was submitted by the entrant:
Victoria Police has made use of GIS technology since the 1990's to map and analyze crime, in support of an 'intelligence-led' approach. With over 300 intelligence analysts making use of desktop mapping applications, Victoria Police relies on GIS to identify problems, locate activity hotspots, and target resources effectively. Victoria Police use GIS to map crime incidences on Melbourne's metropolitan train network — a network of 15 lines, containing 830km of track and 211 train stations. With more than 219 million journeys made each year, crime statistics show that travel on the network is mostly safe. However, like all transport systems around the world, the network does experience crime and anti-social behavior, and it is therefore important that police resources are efficiently targeted to reduce crime and maintain public confidence.
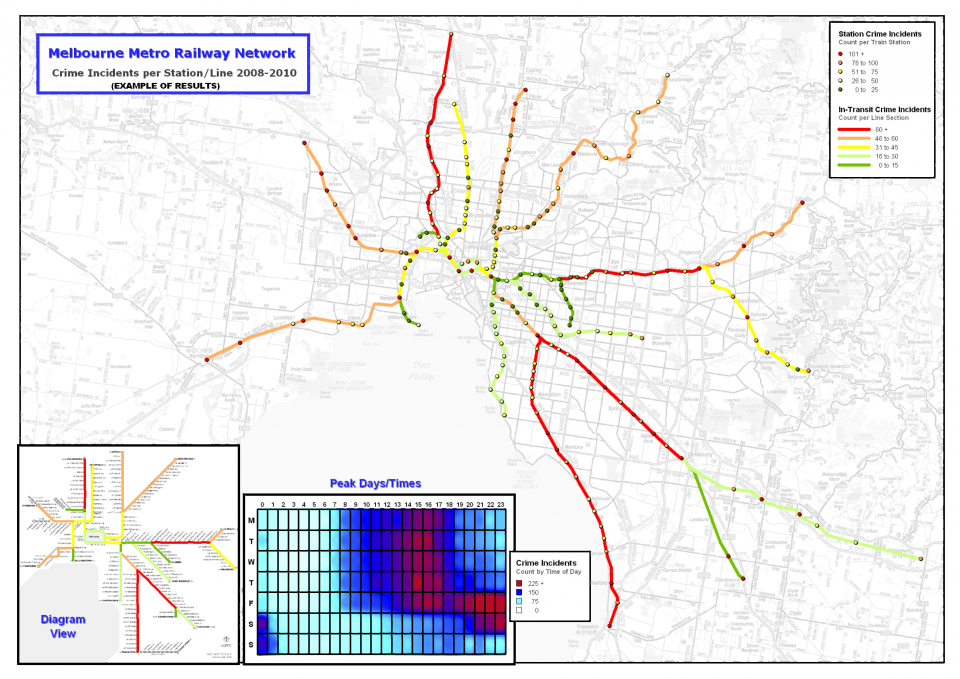
Incidents which occur on a train cannot easily be geocoded to a single point on the map, as they often occur 'in transit'. For example, an act of vandalism may occur while the train is in motion, effectively covering several kilometers of track. To deal with this, a new methodology was developed which calculates the probability that the offence occurred within any of the between-station sections along the railway network. For example, a crime recorded as having occurred over 4 sections would apply a score of 0.25 (or 25% probability) to each of these sections.The following description was submitted by the entrant:
Victoria Police has made use of GIS technology since the 1990's to map and analyze crime, in support of an 'intelligence-led' approach. With over 300 intelligence analysts making use of desktop mapping applications, Victoria Police relies on GIS to identify problems, locate activity hotspots, and target resources effectively. Victoria Police use GIS to map crime incidences on Melbourne's metropolitan train network — a network of 15 lines, containing 830km of track and 211 train stations. With more than 219 million journeys made each year, crime statistics show that travel on the network is mostly safe. However, like all transport systems around the world, the network does experience crime and anti-social behavior, and it is therefore important that police resources are efficiently targeted to reduce crime and maintain public confidence.
These probabilities are then summed for each section, to calculate a total score per section which can be used to thematically shade the sections with the highest count of offences. Utilizing this methodology allows over 95% of the data to be visualized on the map, providing a more complete view of the distribution over the network. Intelligence analysts can then further examine the data using other methods such as temporal analysis, to identify the 'where' and the 'when' for crime reduction patrol targeting.


