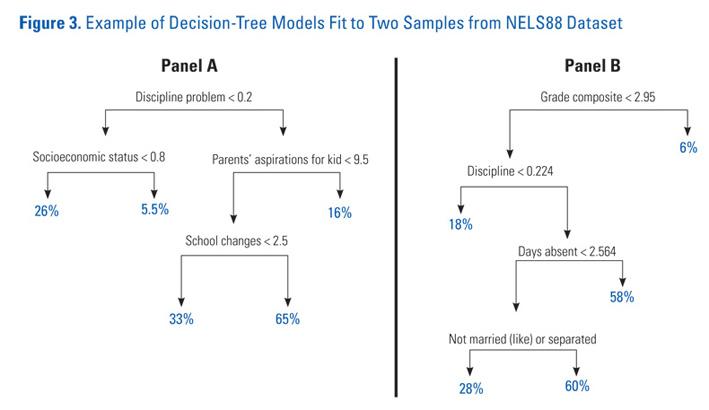
Figure 3: Example of Decision-Tree Models Fit to Two Samples from NELS88 Dataset
This figure is from the article "The Pitfalls of Prediction," February 26, 2013.
Panel A
Did the student have many discipline problems?
- If no, was the student of low socioeconomic status?
- If no, the student had a 5.5 percent risk of dropping out.
- If yes, the student had a 26 percent risk of dropping out.
- If yes, did the parents have low academic aspirations for the student?
- If no, the student had a 16 percent risk of dropping out.
- If yes, did the student rarely change schools?
- If yes, the student had a 33 percent risk of dropping out.
- If no, the student had a 65 percent risk of dropping out.
Panel B
Did the student have a low grade composite?
- If no, the student had a 6 percent risk of dropping out.
- If yes, was the student rarely subject to discipline?
- If yes, the student had an 18 percent risk of dropping out.
- If no, was the student often absent?
- If yes, the student had a 58 percent risk of dropping out.
- If no, were the student's parents married (or in a marriage-like relationship) and living together?
- If yes, the student had a 28 percent risk of dropping out.
- If no, the student had a 60 percent risk of dropping out.
Source: Greg Ridgeway, "The Pitfalls of Prediction," February 26, 2013, nij.ojp.gov: https://nij.ojp.gov/topics/articles/pitfalls-prediction


