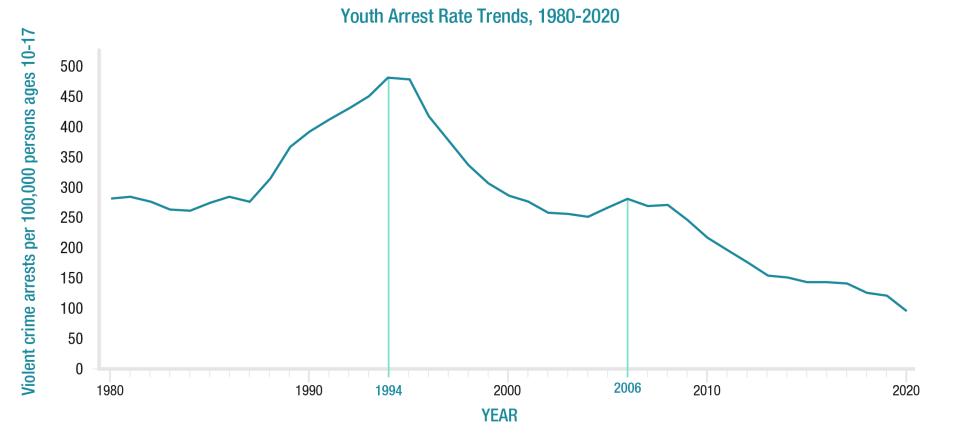
Exhibit 2: Youth arrest rate trends, 1980-2020
This image is Exhibit 2 in the publication "Five Things About Youth and Delinquency."
| Year | Total |
|---|---|
| 1980 | 280.5 |
| 1981 | 281.6 |
| 1982 | 277.5 |
| 1983 | 262.7 |
| 1984 | 259.7 |
| 1985 | 272.8 |
| 1986 | 283.3 |
| 1987 | 275.4 |
| 1988 | 313.6 |
| 1989 | 364.8 |
| 1990 | 390.2 |
| 1991 | 411.2 |
| 1992 | 428.5 |
| 1993 | 449.1 |
| 1994 | 477.8 |
| 1995 | 468.3 |
| 1996 | 413.4 |
| 1997 | 374.8 |
| 1998 | 336.9 |
| 1999 | 305 |
| 2000 | 285.3 |
| 2001 | 276.1 |
| 2002 | 258.6 |
| 2003 | 255.3 |
| 2004 | 251.7 |
| 2005 | 265.1 |
| 2006 | 279.9 |
| 2007 | 269.8 |
| 2008 | 270.6 |
| 2009 | 244.1 |
| 2010 | 216 |
| 2011 | 194 |
| 2012 | 174.9 |
| 2013 | 152.3 |
| 2014 | 151.2 |
| 2015 | 143.7 |
| 2016 | 143.8 |
| 2017 | 141.6 |
| 2018 | 136.1 |
| 2019 | 130.3 |
| 2020 | 96.1 |
"Arrest estimates for 1980-2014 developed by the Bureau of Justice Statistics and disseminated through "Arrest Data Analysis Tool." Online. Available from the BJS website.
Arrest estimates for 2015 through 2020 were developed by the National Center for Juvenile Justice based on the FBI's Annual Master Arrest File of 12-month reporting departments available from the Crime Data Explorer. Arrest estimates for 2015-2019 were revised in June 2022." Statistical Briefing Book. Online. Available: https://ojjdp.ojp.gov/statistical-briefing-book/court/faqs/jar_display?ID=qa05218. July 08, 2022.


