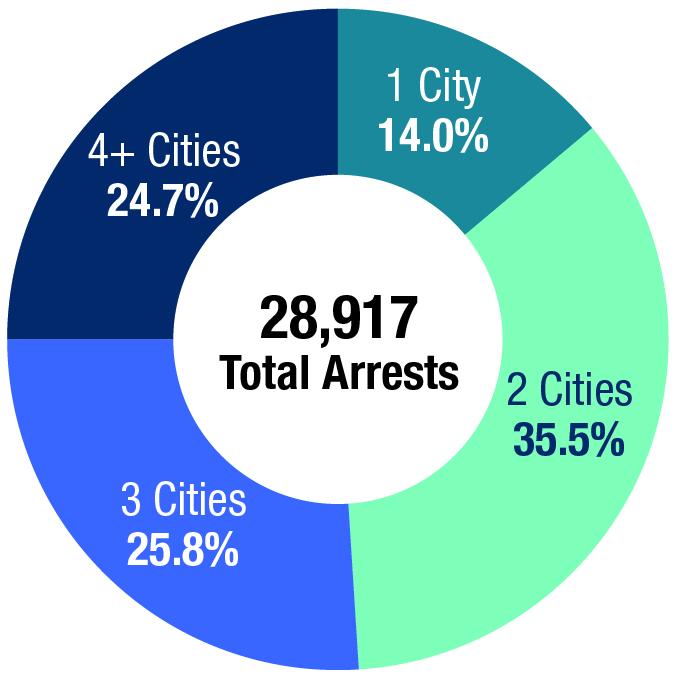
Figure 1. The locations of those arrested five or more times in New Jersey between 2015 and 2022, illustrating cross-jurisdictional mobility. Data provided by the New Jersey State Police (NJSP).
Description
This image is figure 1 in the article Reducing Gun Violence Through Integrated Forensic Evidence Collection, Analysis, and Sharing.
| Number of different cities | Percentage |
|---|---|
| 1 city | 14.0% |
| 2 cities | 35.5% |
| 3 cities | 25.8% |
| 4 or more cities | 24.5% |


