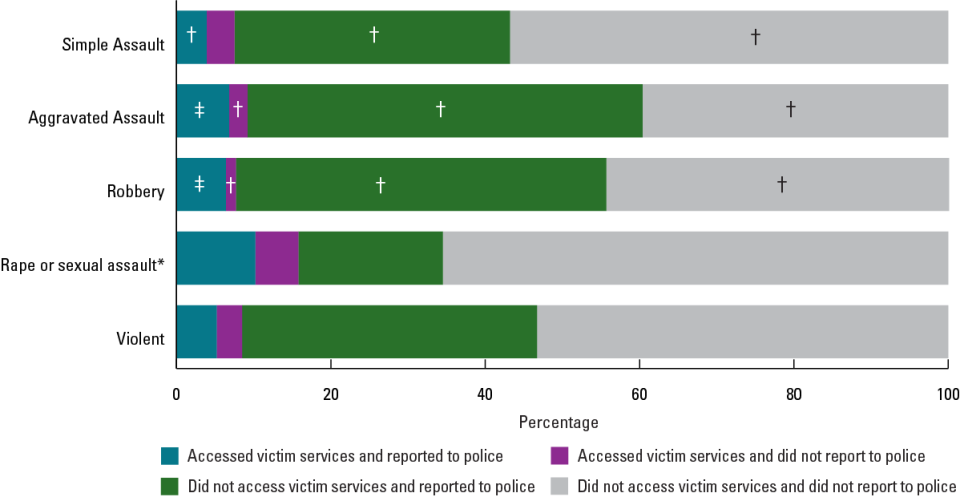
Exhibit 6. Percentage of victimizations for which victims accessed victim services or reported to police, by crime type, 2017-2021
This image is exhibit 6 in the NIJ Journal article "Building Knowledge About Victim Services."
| Type of crime | Accessed victim services and reported to police | Accessed victim services and did not report to police | Did not access victim services and reported to police | Did not access victim services and did not report to police |
|---|---|---|---|---|
| Violent | 5.2 | 3.3 | 38.2 | 53.3 |
| Rape or sexual assault* | 10.2 | 5.6 | 18.7 | 65.5 |
| Robbery | 6.4 | 1.3 | 48.0 | 44.4 |
| Aggravated Assault | 6.8 | 2.4 | 51.2 | 39.6 |
| Simple Assault | 3.9 | 3.6 | 35.7 | 56.8 |
Note: Does not include cases where the victim did not know if they received assistance from a victim service provider or did not know whether the victimization was reported to police. These cases represented about 2.7% of all violent victimizations from 2017-2022. See appendix table 5 for estimates and standard errors.
*Comparison group.
†Difference with comparison group is significant at the 95% confidence level.
‡Difference with comparison group is significant at the 90% confidence level.
Source: Bureau of Justice Statistics, National Crime Victimization Survey, 2017-2021.


