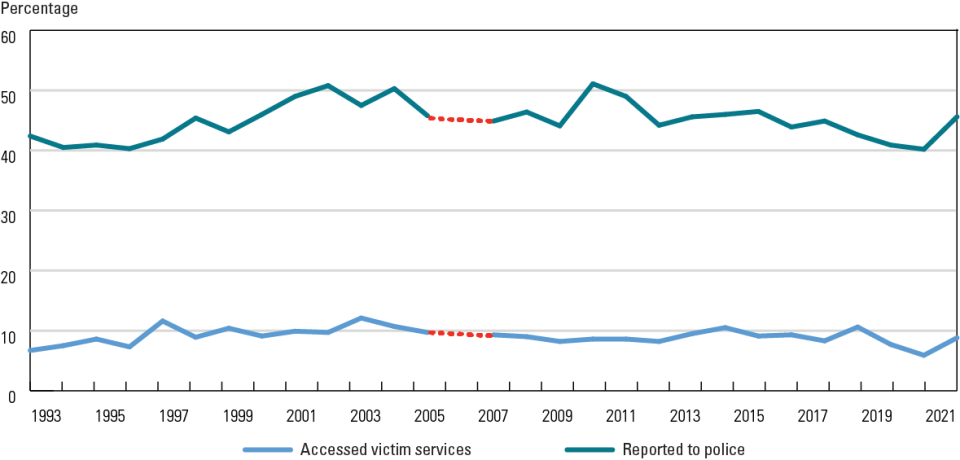
Exhibit 2. Percentage of violent victimizations for which victims received assistance from a victim service provider or reported to police, 1993-2021
This image is Exhibit 2 in the NIJ Journal article "Building Knowledge About Victim Services."
| Year | Accessed victim services | Reported to police |
|---|---|---|
| 1993 | 6.7 | 42.4 |
| 1994 | 7.5 | 40.5 |
| 1995 | 8.6 | 40.9 |
| 1996 | 7.3 | 40.3 |
| 1997 | 11.6 | 41.9 |
| 1998 | 8.9 | 45.4 |
| 1999 | 10.4 | 43.1 |
| 2000 | 9.1 | 46.0 |
| 2001 | 9.9 | 49.0 |
| 2002 | 9.7 | 50.8 |
| 2003 | 12.1 | 47.5 |
| 2004 | 10.7 | 50.3 |
| 2005 | 9.7 | 45.8 |
| 2006 | ||
| 2007 | 9.3 | 44.9 |
| 2008 | 9.0 | 46.4 |
| 2009 | 8.2 | 44.1 |
| 2010 | 8.6 | 51.1 |
| 2011 | 8.6 | 49.0 |
| 2012 | 8.2 | 44.2 |
| 2013 | 9.5 | 45.6 |
| 2014 | 10.5 | 46.0 |
| 2015 | 9.1 | 46.5 |
| 2016 | 9.3 | 43.9 |
| 2017 | 8.3 | 44.9 |
| 2018 | 10.6 | 42.6 |
| 2019 | 7.7 | 40.9 |
| 2020 | 5.9 | 40.2 |
| 2021 | 8.8 | 45.6 |
Note: Violent crime includes rape or sexual assault, robbery, aggravated assault, and simple assault. Estimates for 2006 should not be compared to other years. See Criminal Victimization, 2007 (NCJ 224390, BJS, December 2008) for more information on changes to the 2006 National Crime Victimization Survey. See appendix table 1 for estimates and standard errors.
Source: Bureau of Justice Statistics, National Crime Victimization Survey, 1993–2021.


