Aviso de archivo
Esta es una página de archivo que ya no se actualiza. Puede contener información desactualizada y es posible que los enlaces ya no funcionen como se pretendía originalmente.
Home | Glossary | Resources | Help | Contact Us | Course Map
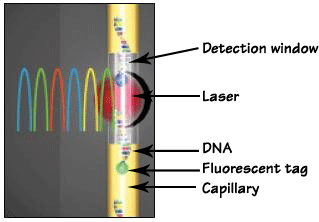
Most capillary electrophoresis (CE) systems use a form of spectroscopic detection, namely laser-based excitation of the fluorescently labeled DNA fragments. Laser light is directed on to the end of the capillary through the cell window. The laser excites the dyes, or colored fluorophores (molecules that are capable of fluorescence), so that DNA fragments are illuminated as they pass by this window. The fluorophores primarily used in DNA labeling are dyes that fluoresce in the visible region of the spectrum (approximately 400-600nm). Each measured single-stranded DNA fragment contains a fluorescent label on the 5' end of the primers that are incorporated in the PCR (Polymerase Chain Reaction) step.
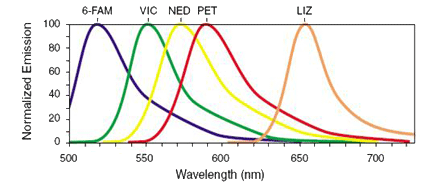
Each fluorescent dye emits its maximum fluorescence at a different wavelength. The emitted fluorescence is passed through a diffraction grating and is captured by a CCD (charge-coupled device) camera. The grating separates the fluorescence of each dye, although there is a degree of overlap. The output is sufficiently separated to allow for the analysis of loci which are of similar size but have different fluorescence labels.
The precise spectral overlap between the dyes is measured by running DNA fragments labeled with each of the dyes in separate CE injections, producing a matrix file. The matrix file allows for multi-component analysis. The appropriate matrix file can be applied to data on a CE run, and the software automatically applies a mathematical matrix calculation (using the matrix file) to all sample data to adjust for the spectral overlap.
The response from the detector is measured in relative fluorescent units (RFU). The RFU correlates to the relative quantity of DNA in the sample based on its response from the detector. The output from the instrument is represented as peaks in an electropherogram with an x and y axis.
The x-axis is a measure of time plotted as scan data points, and the y-axis is plotted as RFUs. The time correlates to the size of the DNA fragment, with the smallest fragments detected first, and the largest fragments detected last.
Additional Online Courses
- What Every First Responding Officer Should Know About DNA Evidence
- Collecting DNA Evidence at Property Crime Scenes
- DNA – A Prosecutor’s Practice Notebook
- Crime Scene and DNA Basics
- Laboratory Safety Programs
- DNA Amplification
- Population Genetics and Statistics
- Non-STR DNA Markers: SNPs, Y-STRs, LCN and mtDNA
- Firearms Examiner Training
- Forensic DNA Education for Law Enforcement Decisionmakers
- What Every Investigator and Evidence Technician Should Know About DNA Evidence
- Principles of Forensic DNA for Officers of the Court
- Law 101: Legal Guide for the Forensic Expert
- Laboratory Orientation and Testing of Body Fluids and Tissues
- DNA Extraction and Quantitation
- STR Data Analysis and Interpretation
- Communication Skills, Report Writing, and Courtroom Testimony
- Español for Law Enforcement
- Amplified DNA Product Separation for Forensic Analysts


