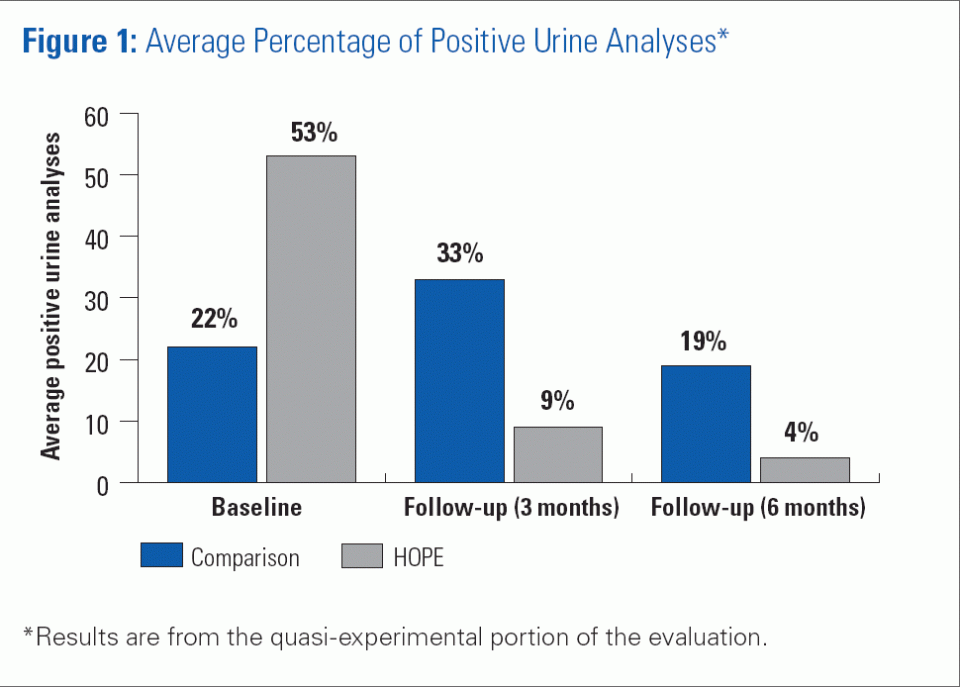
Figure 1: Average Percentage of Positive Urine Analyses
This chart shows the average percentages of positive urine analyses between probationers in the HOPE program and in a comparison group. The results are from the quasi-experimental portion of the evaluation. At the program baseline, 22 percent of probationers from the comparison group had positive UAs and 53 percent of HOPE participants had positive UAs. At a three-month follow-up, 33 percent of probationers from the comparison group had positive UAs and 9 percent of HOPE participants had positive UAs. At a six-month follow up, 19 percent of probationers from the comparison group had positive UAs and 4 percent of HOPE participants had positive UAs.


